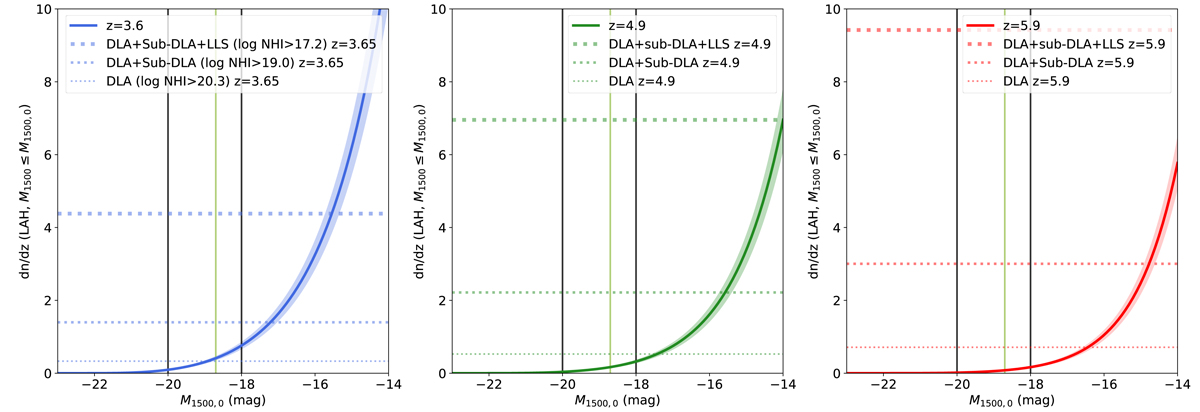
Fig. 13.
Download original image
Cumulative incidence rate of LAHs, dn/dz(LAH, M1500 ≤ M1500, 0), as a function of M1500, 0 at different redshifts. The different colors (blue, green, and red) indicate different redshifts (z ≃ 3.65, 4.9, and 5.9 in panels a–c, respectively). The solid black vertical lines show the M1500 of the brightest and faintest sources in our sample. The green vertical line indicates the upper limit of M1500 for the UV-bright sample. (a) At z ≃ 3.65. The blue solid line and shading show the dn/dz(LAH, M1500 ≤ M1500, 0) and the uncertainty, respectively. The blue-dashed thin line, medium-thick line, and thick line represent the dn/dz for DLAs, DLAs+sub-DLAs, and DLAs+sub-DLAs+LLSs at the same redshift, respectively. (b) At z ≃ 4.9. (c) At z ≃ 5.9.
Current usage metrics show cumulative count of Article Views (full-text article views including HTML views, PDF and ePub downloads, according to the available data) and Abstracts Views on Vision4Press platform.
Data correspond to usage on the plateform after 2015. The current usage metrics is available 48-96 hours after online publication and is updated daily on week days.
Initial download of the metrics may take a while.