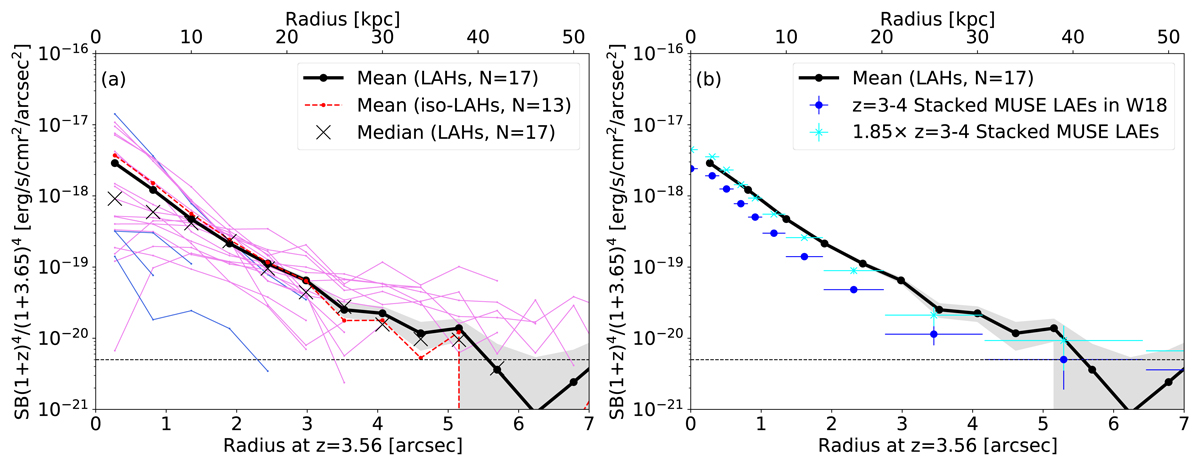
Fig. 11.
Download original image
Typical Lyα SB profiles with cosmic dimming corrections scaled to z = 3.65. (a) The violet and blue solid lines show individual SB profiles of LAHs and non-LAHs, respectively. The black solid line and the gray shaded area indicate the mean SB profile of 17 LAHs and the 1σ uncertainty, respectively, while the red dashed line indicates the mean SB profile of 13 isolated LAHs. The black crosses represent the median profile of the 17 LAHs. The black dashed holizontal line shows the typical 1σ SB limit of the mean LAH stack. (b) The blue circles and cyan crosses show the median SB profile of stacked MUSE LAEs at z = 3 − 4 (Wisotzki et al. 2018, W18) and the same data multiplied by 1.85 to compare the profile shapes.
Current usage metrics show cumulative count of Article Views (full-text article views including HTML views, PDF and ePub downloads, according to the available data) and Abstracts Views on Vision4Press platform.
Data correspond to usage on the plateform after 2015. The current usage metrics is available 48-96 hours after online publication and is updated daily on week days.
Initial download of the metrics may take a while.