Fig. 1.
Download original image
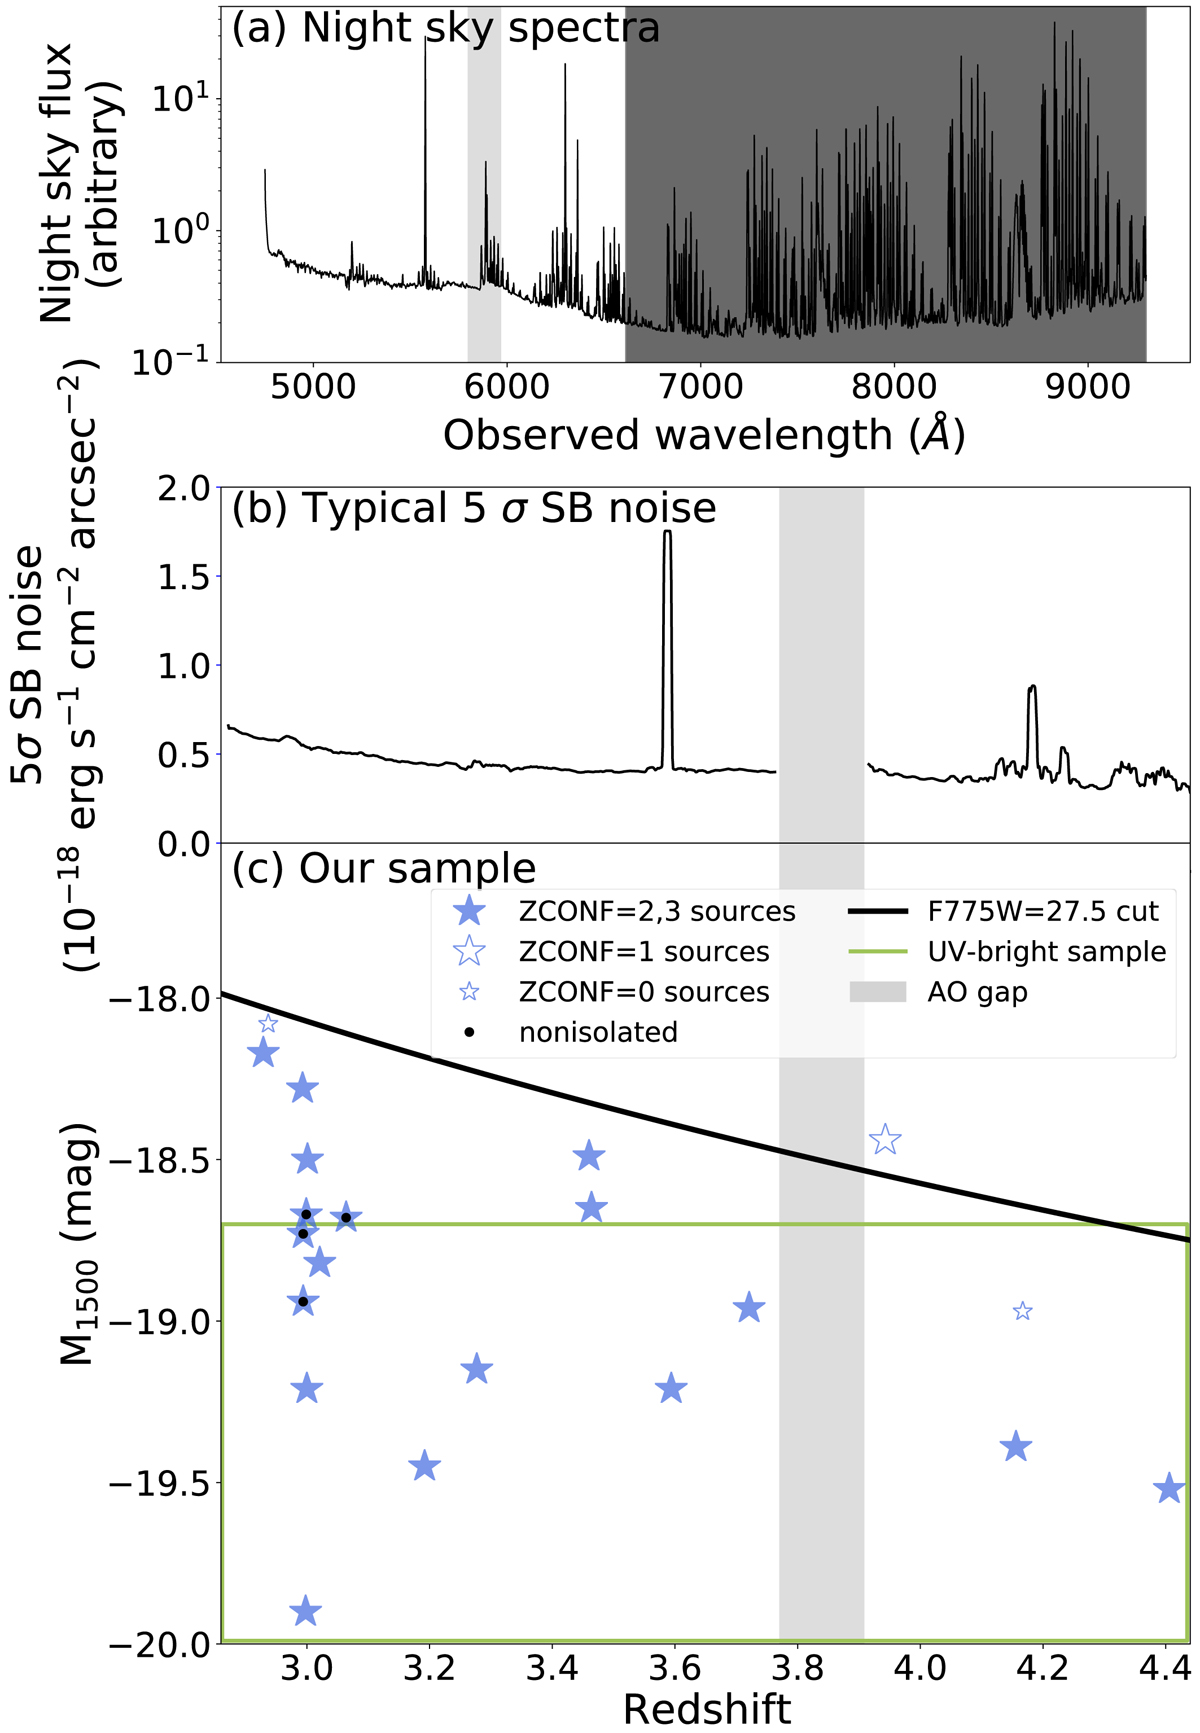
(a) Night sky spectrum as a function of observed wavelength. The black line shows the night sky spectrum with an arbitrary normalization. The light gray and dark shaded areas indicate the wavelength range of the AO gap and the wavelength range that is not used in this work, respectively. (b) 5σ noise surface brightness (SB) for the typical parameters for optimized NBs (see Sect. 3.2) as a function of redshift (black line). The light gray shaded area indicates the redshift range of the AO gap. (c) M1500 as a function of z for the sample. The large filled blue stars, large open blue stars, and small open blue stars indicate our sources with ZCONF = 2, 3, ZCONF = 1, and ZCONF = 0, respectively. The black dots show nonisolated galaxies (see Sect. 2.2). The black and green lines represent the F775W apparent magnitude cut, and the criteria for the UV-bright sample, respectively.
Current usage metrics show cumulative count of Article Views (full-text article views including HTML views, PDF and ePub downloads, according to the available data) and Abstracts Views on Vision4Press platform.
Data correspond to usage on the plateform after 2015. The current usage metrics is available 48-96 hours after online publication and is updated daily on week days.
Initial download of the metrics may take a while.