| Issue |
A&A
Volume 660, April 2022
|
|
|---|---|---|
| Article Number | A53 | |
| Number of page(s) | 7 | |
| Section | Stellar structure and evolution | |
| DOI | https://doi.org/10.1051/0004-6361/202142163 | |
| Published online | 12 April 2022 | |
Mixing fraction in classical novae
1
Yunnan Observatories, Chinese Academy of Sciences, Kunming 650216, PR China
e-mail: This email address is being protected from spambots. You need JavaScript enabled to view it.
; This email address is being protected from spambots. You need JavaScript enabled to view it.
2
University of Chinese Academy of Sciences, Beijing 100049, PR China
Received:
6
September
2021
Accepted:
10
February
2022
Abstract
Context. Classical novae are powered by thermonuclear runaways occurring on the surface of accreting white dwarfs (WDs). In the observations, the enrichments of heavy elements in nova ejecta have been detected, indicating a mixing process between the accreted matter and the matter from the outer layers of the underlying WDs prior to nova outbursts. However, the mixing fraction in classical novae is still uncertain.
Aims. The purpose of this article is to investigate some elemental abundance ratios during nova outbursts that can be used to estimate the WD mixing fraction in classical novae.
Methods. By considering different WD mixing fractions with the stellar evolution code Modules for Experiments in Stellar Astrophysics, we carried out a series of simulations of nova outbursts, in which the initial CO WD masses range from 0.7−1.0 M⊙.
Results. We identified four elemental abundance ratios (i.e. (H + He)/∑CNO, (H + He)/Ne, ∑CNO/Mg, and ∑CNO/Si) that satisfy the conditions for determining the WD mixing fraction, in which (H + He)/∑CNO is the most suitable mixing meter. We also estimated the WD mixing fraction in some representative classical novae. Additionally, we found that a higher metallicity (i.e. higher WD mixing fraction) is preferentially accompanied by a longer t2 (the time of decline by two magnitudes from peak luminosity) during nova outbursts. Our results can be used to constrain the mixing process in classical novae.
Key words: novae, cataclysmic variables / white dwarfs
© ESO 2022
1. Introduction
It is generally thought that classical novae are powered by thermonuclear runaways occurring on the surface of white dwarfs (WDs) in close binaries, in which the WDs accrete matter from a main-sequence companion through the inner Lagrangian point when the companion fills its Roche lobe (e.g. José 2016; Chomiuk et al. 2021). Classical novae are suggested as noteworthy contributors to the Galactic chemical evolution, providing about 0.3% of the interstellar matter in the Galaxy. The nuclides 13C, 15N, and 17O in the interstellar medium are thought to be mainly synthesised by classical novae (e.g. José & Hernanz 1998; Denissenkov et al. 2014). In addition, classical novae are suggested to be the progenitors of type Ia supernovae and accretion-induced collapse events (see, e.g. Wang 2018; Wang & Liu 2020).
Observationally, the enrichments of intermediate-mass elements (e.g. C, N, O, Ne, Na, Mg, and Al) have been detected in nova ejecta, indicating that the accreted shell is mixed with the outer layers of the underlying WD (e.g. Livio & Truran 1994; Gehrz et al. 1998). Two types of WDs in nova systems can be identified by the spectroscopic studies for nova ejecta: carbon-oxygen (CO) WDs, and oxygen-neon (ONe) WDs. Some mechanisms from one-dimensional models have been proposed to explain the mixing process, including diffusion-induced convection (e.g. Prialnik & Kovetz 1984; Fujimoto & Iben 1992), shear mixing (e.g. Durisen 1977; Kippenhahn & Thomas 1978; MacDonald 1983; Kutter & Sparks 1987; Fujimoto 1988), and convective overshoot-induced flame propagation (see, e.g. Woosley 1986). For multidimensional models, the mechanisms include mixing by resonant gravity waves (e.g. Rosner et al. 2001; Alexakis et al. 2004) and Kelvin-Helmholtz instabilities (e.g. Glasner & Livne 1995; Glasner et al. 1997, 2005, 2007, 2012; Casanova et al. 2010, 2011, 2016, 2018).
The chemical abundances in nova ejecta have been proposed as a way to reveal the characteristics of the nova outbursts. José & Hernanz (1998) studied five classical novae by simulating 14 evolutionary sequences of CO/ONe nova models, spanning a range of WD masses and WD mixing fractions. Their results indicate that the significant 19F, 35Cl, and low O/N, C/N ratios can be reproduced in the nova systems with a massive ONe WD. Downen et al. (2013) found some useful elemental abundance ratios strongly correlated with the peak temperatures during nova outbursts (e.g. N/O, N/Al, and O/S), providing a way to determine the WD mass. Kelly et al. (2013) identified some elemental abundance ratios (e.g. ∑ CNO/H, Ne/H, Mg/H, Al/H, and Si/H) to estimate the mixing fraction for ONe novae and provided some constraints on the study of the WD mixing process. These ratios show a strong dependence on the mixing fraction, but they are not significantly affected by the WD mass.
The enrichments of He have also been detected in classical novae (e.g. GQ Mus, HR Del, and RR Pic), indicating that there could be a mixing process between the He shell and the accreted material (e.g. Truran & Livio 1986; Gehrz et al. 1998). Starrfield et al. (1998) suggested that the accreted material may have mixed with the He layer by diffusion or accretion-driven shear mixing before the dredge-up of the WD material. In addition, it is also possible that the WD material has enriched in the He layer due to the previous evolutionary history, which means that the mixing of the accreted material and the He layer can naturally increase the abundance of He and WD matter. By assuming the mixing of the He shell and the accreted material in multidimensional simulations, Glasner et al. (2012) estimated that the He mixing fraction is about 20%. Mixing with different chemical substrates has also been reported in Casanova et al. (2016, 2018). Guo et al. (2021a) recently reproduced the chemical abundances in some novae with He enrichments by considering the He and WD mixing process. They found that the He mixing level in classical novae is lower than 30%.
The purpose of this article is to study several elemental abundance ratios that can be used to estimate the WD mixing fraction in CO novae. These ratios should be sensitive to the WD mixing degree but not affected by the WD mass1. In addition, it is worth noting that these ratios cannot be affected by the He mixing that could occur in CO novae because the abundances of H and He in nova ejecta are sensitive to the He mixing fractions (see Guo et al. 2021b). This paper is organised as follows. In Sect. 2 we introduce the basic assumptions and methods for numerical calculations. In Sect. 3 we identify some WD mixing meters and estimate the WD mixing fraction in several representative CO novae. In addition, we show the relation between t2 (the time of decline by two magnitudes from peak luminosity) and the metallicity in nova ejecta. Finally, we present a discussion in Sect. 4 and a summary in Sect. 5.
2. Numerical methods and assumptions
2.1. Nova models
The stellar evolution code we used in our simulations is called Modules for Experiments in Stellar Astrophysics (MESA, version 10398; see Paxton et al. 2011, 2013, 2015, 2018). It is widely accepted that the properties of classical novae (e.g. light curves, timescales, nucleosynthesis, and ejecta mass) depend on the WD mass (MWD), the mass-accretion rate (Ṁacc), the initial luminosity of WDs, and the composition of accreted matter (e.g. Yaron et al. 2005; Wolf et al. 2013; Rukeya et al. 2017; Wang 2018). In the present work, we created the CO WD models with an initial mass range of 0.7−1.0 M⊙2. Following Guo et al. (2021b), our initial WD models have a luminosity of 10−2 L⊙, and the accretion rate (Ṁacc) in the nova models is 2 × 10⁻⁹ M⊙yr−1. The nuclear reaction network is coupled by 86 isotopes from 1H-48Ca, including 794 nuclear reactions. In addition, we did not consider the influence of rotation and convective overshooting in this work.
We adopted the super-Eddington wind as the mass-loss mechanism during nova outbursts, in which the super-Eddington luminosity (LEdd) and the wind mass-loss rate (Ṁ) can be expressed as follows (e.g. Denissenkov et al. 2012; Wang et al. 2015; Wu et al. 2017; Guo et al. 2021a):
 (1)
(1)
 (2)
(2)
where G, c, and τ are the gravitational constant, the vacuum speed of light, and the Rosseland mean opacity, and ηEdd and υesc are the super-Eddington wind factor and escape velocity, respectively. The super-Eddington wind is triggered when the WD luminosity exceeds the Eddington luminosity, and all the radiant energy exceeding Eddington luminosity is used to eject matter (i.e. ηEdd = 1).
2.2. White dwarf mixing
We adopted the pre-mixed model described in Politano et al. (1995), in which the material accreted by WDs is assumed to be a mixture of the companion star material (solar abundances) and the outermost layers of the underlying CO WDs. Different WD mixing degrees can be modified by artificially giving the various abundance of the WD material in the mixture. In our simulations, we assumed that the WD material mixed with the accreted layer is composed of X(12C) = 0.495, X(16O) = 0.495, and X(22Ne) = 0.01 (e.g. José & Hernanz 1998; Guo et al. 2021b). In order to understand the dependence of chemical abundances in nova ejecta on the WD mixing level, we carried out a series of calculations for our nova models with different WD mixing fractions (fWD)≤40%.
2.3. Helium mixing
In order to test whether the He mixing has an effect on the WD mixing meters, we calculated some nova models, including both the He and WD mixing (see the second paragraph of Sect. 3.1.1 for details). Following the studies of Guo et al. (2021b), we mixed the accreted material with a given mass fraction of He layer and WD material. Similar to the method of the WD mixing, the He mixing degrees can be modified by considering the various abundance of the He-rich material in the mixture. If we only consider the He mixing during the outbursts, the He mass fraction in the already mixed envelope (XHe) is contributed by the mixed He shell and the accreted material. We assumed the mass ratio of the mixed He shell to the already mixed envelope as the He mixing fraction (fHe), and set the He abundance in accreted material and He shell was 28% and 100%, respectively. Thus, the He mass fraction can be calculated by XHe = fHe + 0.28 × (1 − fHe), in which 0.28 × (1 − fHe) represents the He abundance contributed by the accreted material. Similarly, if we further consider both He mixing and WD mixing during the outbursts, then XHe = [fHe + 0.28 × (1 − fHe)] × (1 − fWD), in which fWD is the given WD mixing fraction3.
3. Numerical results
3.1. WD mixing meters
We performed a series of simulations for nova models with different WD masses and WD mixing degrees. Table 1 lists the main properties of initial nova models computed in this work, as well as the characteristics of the outbursts. Figure 1 presents some chemical abundances (i.e. H-Ar) in nova ejecta that change with different WD mixing fractions, in which we set the initial WD mass to be 0.9 M⊙. Obviously, C, N, O, F and Ne exhibit a strong monotonic increase with the WD mixing levels, while other elements show the opposite trend. The abundances of some elements are relatively low (e.g. F, P, and Cl) or they are rarely detected in CO nova ejecta (e.g. Al, S, and Ar). Thus, these elements cannot be used as the WD mixing meters. We studied the elemental abundance ratios that satisfy the conditions for determining the WD mixing degree, for instance (H + He)/∑ CNO, (H + He)/Ne, ∑ CNO/Mg, and ∑ CNO/Si.
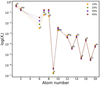 |
Fig. 1. Elemental abundances (mass fraction) in nova ejecta vs. atomic number, in which we set the WD mixing fraction ≤40% and the WD mass to be 0.9 M⊙. Differently coloured lines represent different WD mixing fractions. |
Initial parameters of nova models and the characteristics of the outbursts.
3.1.1. (H + He)/∑ CNO
Previous studies suggested that the peak temperature attained in the H-burning shell does not exceed 4 × 10⁸ K during nova outbursts (e.g. Livio & Truran 1994; Denissenkov et al. 2012). The sum abundance of C, N, and O (∑ CNO) would not change significantly in this temperature regime (e.g. Truran & Livio 1986; José & Hernanz 1998). For this reason, Kelly et al. (2013) used H/∑ CNO to measure the WD mixing degree in ONe novae.
However, it is not negligible to verify whether the WD mixing meters are affected by the He mixing that may occur in CO novae. We therefore performed a series of calculations for nova models with a He mixing fraction ranging from 0−20%, where we set the WD mass to be 0.7 M⊙ and the WD mixing fraction to be 20%. Figure 2 shows the variation in elemental abundance (mass fraction) ratios with different He mixing degrees. The value of H/∑ CNO is significantly affected by the He mixing fraction, while the effect can be eliminated by choosing (H + He)/∑ CNO (see Fig. 2a). This is because for a given WD mixing degree, the abundance of H+He and heavy elements in nova ejecta is hardly changed by the He mixing process (see Table 3 in Guo et al. 2021b).
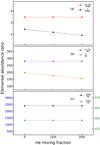 |
Fig. 2. Elemental abundance (mass fraction) ratios that may be candidates for the WD mixing meters vary with different He mixing degrees, in which we set the WD mass to be 0.7 M⊙ and the WD mixing fraction to be 20%. Panel a: results of (H + He)/∑ CNO and H/∑ CNO. Panel b: results of (H + He)/Ne and H/Ne. Panel c: results of ∑ CNO/Mg and ∑ CNO/Si. |
Figure 3 represents the changes in four elemental abundance ratios with different WD mixing fractions and peak temperatures, where the peak temperature corresponds to the WD mass in the range of 0.7−1.0 M⊙. As shown in Fig. 3a, (H + He)/∑ CNO is weakly affected by the peak temperature but strongly depends on the WD mixing fraction, indicating that (H + He)/∑ CNO can be used to determine the WD mixing fraction.
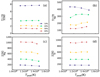 |
Fig. 3. Peak temperature vs. the elemental abundance ratios that can be used to determine the WD mixing fraction, where the peak temperature corresponds to the WD mass in the range of 0.7−1.0 M⊙. Different colours represent different WD mixing fractions. Panel a: results of (H + He)/∑ CNO. Panel b: results of (H + He)/Ne. Panel c: results of ∑ CNO/Mg. Panel d: results of ∑ CNO/Si. |
3.1.2. (H + He)/Ne
Table 2 lists the Ne abundance in different nova models, including the results of José & Hernanz (1998) and this work. These simulations show that the abundance of Ne hardly changes with the WD mass for a given WD mixing fraction. As shown in Fig. 2b, (H + He)/Ne is more suitable for the WD mixing meter than H/Ne because of the weak dependence of the former on the He mixing fraction. Meanwhile, (H + He)/Ne shows a weak dependence on the peak temperature, whereas sensitive to the WD mixing fraction (see Fig. 3b). Thus, (H + He)/Ne can also be a WD mixing meter.
Comparison of the neon abundance of José & Hernanz (1998) and this work.
3.1.3. ∑ CNO/Mg and ∑ CNO/Si
Downen et al. (2013) studied the ratio of final to initial elemental abundances during nova outbursts that change with different WD masses. Their results show that the abundances of Mg and Si are hardly affected by the WD mass. Figure 2c shows that ∑ CNO/Mg and ∑ CNO/Si are not affected by the He mixing fraction. We present the changes in ∑ CNO/Mg and ∑ CNO/Si with peak temperature in Fig. 3c–d, respectively. These two abundance ratios are clearly weakly dependent on the WD mass, but strongly depend on the WD mixing degree. This means that ∑ CNO/Mg and ∑ CNO/Si meet the conditions for determining the WD mixing degree.
3.2. Comparison to observations
Figure 4 shows the values of these four ratios with different WD mixing degrees, as well as the estimation of WD mixing levels in six representative novae, that is, GQ Mus, PW Vul, V842 Cen, V827 Her, V723 Cas, and V2214 Oph. GQ Mus is a classical nova, showing signs of the He and metal enrichments. According to the studies of Guo et al. (2021b), the WD and He mixing level in this nova are 20% and 30%, respectively. Similarly, the simulations in this work show that the WD mixing fraction in GQ Mus is about 20%. For nova PW Vul, (H + He)/∑ CNO and (H + He)/Ne imply that the WD mixing fraction is about 30%, which is consistent with the results of José & Hernanz (1998).
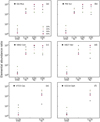 |
Fig. 4. WD mixing fractions in some representative classical novae determined by different elemental abundance ratios. Different marks represent the WD mixing degree from 10%−40%. The black stars refer to the observed data. The error bar represents the effect of the peak temperature on the elemental abundance ratios. Panel a: results of GQ Mus (Morisset & Pequignot 1996). Panel b: results of PW Vul (Andreä et al. 1994). Panel c: results of V842 Cen (Andreä et al. 1994). Panel d: results of V827 Her (Andreä et al. 1994). Panel e: results of V723 Cas (Iijima 2006). Panel f: Results of V2214 Oph (Andreä et al. 1994). |
In the case of nova V842 Cen, the WD mixing fraction in the range of 30%−40% is estimated by (H + He)/∑ CNO, while (H + He)/Ne implies a value lower than 10%. For nova V827 Her, (H + He)/∑ CNO indicates a WD mixing fraction of 30%, while (H + He)/Ne shows a value lower than 10%. Nova V723 Cas shows a WD mixing fraction below 10% by the estimation of (H + He)/∑ CNO, while a value far greater than 40% is suggested by (H + He)/Ne. V2214 Oph is also a classical nova showing He enrichments, and the He mixing fraction is about 13% (see Guo et al. 2021b). For this nova, (H + He)/∑ CNO implies a WD mixing degree in the range of 30%−40%, while (H + He)/Ne indicates that the value is higher than 40%. In addition, DQ Her exhibits a high enrichment of CNO, but only H, He, C, N, and O were determined by Petitjean et al. (1990). According to our simulations, we speculate that the WD mixing fraction of this nova is greater than 40%.
Figure 4 also represents the WD mixing fractions measured by ∑ CNO/Mg and ∑ CNO/Si. We note that the measurement results of these two ratios only poorly agree with (H + He)/∑ CNO and (H + He)/Ne (for more discussions, see Sect. 4). This figure shows that the WD mixing degree in classical novae spans a relatively wide range.
3.3. Relation between t2 and the metallicity in CO novae
In order to explore the physical parameters that affect the WD mixing fraction, we summarised the observed data of CO novae listed in Gehrz et al. (1998), in which the selected novae show obvious signs of the WD mixing (i.e. the metallicity Z > 0.1). Figure 5 shows the relation between t2 and Z in these classical novae, where t2 is the time of decline by two magnitudes from peak brightness. We used t2 instead of WD mass or accretion rate because t2 can be obtained directly from the observations, and the metallicity was chosen because it can reflect the WD mixing fraction in classical novae.
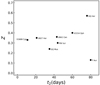 |
Fig. 5. Relation between t2 and the metallicity in nova ejecta (Z), in which these novae are listed in Gehrz et al. (1998). We only selected classical novae that show significant signs of the WD mixing (Z > 0.1). t2 is the time of decline by two magnitudes from peak brightness, which can be directly derived from the observations. |
As shown in Fig. 5, the longer t2 time tends to correspond to higher metallicities in classical novae. It is generally thought that a faster-declining nova that has a shorter t2 implies a more massive WD in the nova system4 Thus, the trend illustrated in Fig. 5 indicates that a high metallicity (i.e. high WD mixing fraction) may exist in nova systems with less massive WDs, except for the particular object nova T Aur, i.e. a low metallicity, but with t2 close to that of DQ Her.
The WD mass would affect the mixing time, and this in turn affects the metallicity in classical novae. It has been suggested that the temperature at the envelope base (Tbase) is about 108 K when the convection has already extended throughout the whole envelope (e.g. José et al. 2016). In multidimensional simulations, Casanova et al. (2011) mapped a 1D nova model on a 2D or 3D Cartesian grid when Tbase reached 108 K by considering multidimensional mixing (see also Casanova et al. 2018). José & Hernanz (1998) studied the effect of the WD mass on the time required from 108 K to the peak temperature (tmax). They found that tmax decreases with the WD mass, which means that a shorter mixing time exist in nova systems with massive WDs, resulting in a low WD mixing degree.
4. Discussion
As shown in Fig. 4, the WD mixing degree measured by different mixing meters may be inconsistent. It has been suggested that the elements C and O are the main components in the underlying CO WDs based on studies of stellar evolution and asteroseismology (e.g. Umeda et al. 1999; Giammichele et al. 2018). Consequently, the WD material mixed with the accreted envelope is mainly composed of C and O, indicating that (H + He)/∑ CNO is the most suitable elemental abundance ratio for estimating the WD mixing level. On the other hand, the abundances of Mg and Si in CO novae are relatively low, hence they are not good candidates for the WD mixing meters.
According to stellar evolution theories, 22Ne is produced by 14N(α,γ)18F (e+v) 18O(α,γ)22Ne when stars evolve to the He-burning phase, which means that 22Ne becomes the dominant neon isotope in CO WDs. We set the mass fraction of 22Ne in the WD material to 0.01. However, the 22Ne abundance in CO WDs may be different from our assumptions due to the different metallicity environments (Umeda et al. 1999), which will affect the WD mixing degrees measured by (H + He)/Ne. For example, V723 Cas has an Ne abundance as high as the abundances of ONe novae, but it was identified as a CO nova (see Iijima 2006). This high abundance of Ne is due to the high concentration of 22Ne in the underlying CO WD (Livio & Truran 1994; Hachisu & Kato 2016), and it means that the WD mixing degree measured by (H + He)/Ne is much higher than 40% (see Fig. 4e).
Table 2 shows that the ratio of Ne abundance to the metallicity (Ne/Z) in nova ejecta weakly dependends on the WD mass and the WD mixing degree, and its value is consistent with the Ne abundance set in the CO WD model (i.e. X(22Ne) = 0.01). Thus, we expect that the Ne abundance in WDs (X(22Ne)) can be represented by the value of Ne/Z in nova ejecta. Figure 6 shows the relation between t2 and Ne/Z obtained from six classical novae, where these novae show obvious signs of WD mixing (Z > 0.1). Some other novae (e.g. V1668 Cyg, DQ Her and T Aur) are not presented here because no information about the Ne abundance is available in the references (e.g. Gallagher et al. 1980; Petitjean et al. 1990; Andreä et al. 1994). As shown in Fig. 6, lower Ne/Z (i.e. X(22Ne)) is preferentially detected in the faster nova systems (i.e. shorter t2), corresponding to the massive WDs. Previous studies suggested that as the stellar population metallicity increases, the 22Ne abundance increases while the WD mass decreases (see, e.g. Umeda et al. 1999). Thus, we speculate that these novae shown in Fig. 6 may have different stellar population metallicities.
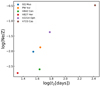 |
Fig. 6. Relation between t2 and the value of Ne/Z obtained from some classical novae, in which these novae show obvious signs of WD mixing (Z > 0.1). |
By assuming the mixing process driven by Kelvin-Helmholtz instabilities in the multidimensional simulations, Casanova et al. (2018) suggested that the mixing fraction in nova systems increases with the WD mass due to the higher base density and peak temperatures. However, in their simulations, the metallicities in novae with less massive WDs are lower than the metallicity of the observed values, for instance Z = 0.0268 for 0.8 M⊙, and Z = 0.0772 for 1 M⊙ in CO novae. We note that the nova models calculated in their work involve a limited number of combinations of WD masses and accretion rates. Thus, the influence of WD mass and other parameters such as the mass-accretion rate on the WD mixing deserves further analysis.
The observed He enrichments in classical novae imply that helium can be accumulated on the WD surface. We speculate that the WD mass could affect the thickness of He shell, in which the heavier He shell is expected to accumulate on the surface of low-mass WDs owing to the weaker outbursts caused by the relatively low degeneracy of the H shell. Chen et al. (2019) studied the characteristics of nova outburst by considering a wide range of WD masses and mass-accretion rates. They found that low-mass WDs can lead to relatively high accreted masses and mass-accumulative efficiencies for a given mass-accretion rate. In addition, Glasner et al. (2012) showed that the He mixing level in nova systems is about 20%, indicating that the mixed He shell mass is ∼20% of the critical mass.
5. Summary
By employing the stellar evolution code MESA, we investigated the elemental abundance ratios during nova outbursts. These ratios can be used to estimate the WD mixing fraction in CO novae. They show a weak dependence on the WD mass and the He mixing, but they are sensitive to the WD mixing fraction. We identified the elemental abundance ratios (H + He)/∑ CNO, (H + He)/Ne, ∑ CNO/Mg, and ∑ CNO/Si that can meet the conditions for determining the WD mixing degree, where (H + He)/∑ CNO is the most useful mixing meter. In addition, we estimated the WD mixing fraction in some representative classical novae. Moreover, we found that a higher metallicity (i.e. higher WD mixing fraction) is preferentially accompanied by a longer t2 time in classical novae. Our work can be used to provide some constraints on the mixing theories in nova systems. In order to better understand the mixing process, more observed samples and theoretical simulations are needed.
Although the WD mixing fraction would be affected by the WD mass (e.g. Casanova et al. 2018), we focus on the measurement of the WD mixing degree, thus the mixing meters must only be sensitive to the mixing degree. The accuracy of the measurement is reduced if the WD mass has an effect on the mixing meters.
The WDs with mass ≲0.6 M⊙ are considered to be hybrid HeCO WDs with a CO-rich core surrounded by a ∼0.1 M⊙ He-rich mantle (e.g. Dan et al. 2012; Yungelson & Kuranov 2017; Liu et al. 2017). According to current stellar evolution theories, the composition of massive WDs is ONe instead of CO if the WD mass is higher than ∼1.05 M⊙ (see Siess 2007).
We assumed that the accreted material mixes first with the He shell and then with the WD material (e.g. Starrfield et al. 1998).
Other parameters (e.g. the accretion rate, the WD initial luminosity, and the composition of the accreted envelope) also affect t2, but the WD mass affects the main trend most (e.g. Yaron et al. 2005; Hachisu & Kato 2016; Hachisu et al. 2020).
Acknowledgments
We thank the anonymous referee for valuable comments that help to improve the paper. BW is supported by the National Natural Science Foundation of China (No 11873085), the science research grants from the China Manned Space Project (Nos CMS-CSST-2021-A13/B07), the Western Light Youth Project of CAS, and the Yunnan Fundamental Research Projects (Nos 2019FJ001 and 202001AS070029). CW is supported by the National Natural Science Foundation of China (No. 12003013). The authors gratefully acknowledge the “PHOENIX Supercomputing Platform” jointly operated by the Binary Population Synthesis Group and the Stellar Astrophysics Group at Yunnan Observatories, Chinese Academy of Sciences.
References
- Alexakis, A., Calder, A. C., Heger, A., et al. 2004, ApJ, 602, 931 [NASA ADS] [CrossRef] [Google Scholar]
- Andreä, J., Drechsel, H., & Starrfield, S. 1994, A&A, 291, 869 [Google Scholar]
- Casanova, J., José, J., García-Berro, E., Calder, A., & Shore, S. N. 2010, A&A, 513, L5 [NASA ADS] [CrossRef] [EDP Sciences] [Google Scholar]
- Casanova, J., José, J., García-Berro, E., Calder, A., & Shore, S. N. 2011, Nature, 478, 490 [NASA ADS] [CrossRef] [Google Scholar]
- Casanova, J., José, J., García-Berro, E., & Shore, S. N. 2016, A&A, 595, A28 [NASA ADS] [CrossRef] [EDP Sciences] [Google Scholar]
- Casanova, J., José, J., & Shore, S. N. 2018, A&A, 619, A121 [NASA ADS] [CrossRef] [EDP Sciences] [Google Scholar]
- Chen, H.-L., Woods, T. E., Yungelson, L. R., et al. 2019, MNRAS, 490, 1678 [NASA ADS] [CrossRef] [Google Scholar]
- Chomiuk, L., Metzger, B. D., & Shen, K. J. 2021, ARA&A, 59, 48 [Google Scholar]
- Dan, M., Rosswog, S., Guillochon, J., & Ramirez-Ruiz, E. 2012, MNRAS, 422, 2417 [NASA ADS] [CrossRef] [Google Scholar]
- Denissenkov, P. A., Herwig, F., Bildsten, L., & Paxton, B. 2012, ApJ, 762, 8 [Google Scholar]
- Denissenkov, P. A., Truran, J. W., Pignatari, M., et al. 2014, MNRAS, 442, 2058 [NASA ADS] [CrossRef] [Google Scholar]
- Downen, L. N., Iliadis, C., José, J., & Starrfield, S. 2013, ApJ, 762, 105 [NASA ADS] [CrossRef] [Google Scholar]
- Durisen, R. H. 1977, ApJ, 213, 145 [NASA ADS] [CrossRef] [Google Scholar]
- Fujimoto, M. Y. 1988, A&A, 198, 163 [NASA ADS] [Google Scholar]
- Fujimoto, M. Y., & Iben, I. 1992, ApJ, 399, 646 [NASA ADS] [CrossRef] [Google Scholar]
- Gallagher, J. S., Hege, E. K., Kopriva, D. A., Williams, R. E., & Butcher, H. R. 1980, ApJ, 237, 55 [NASA ADS] [CrossRef] [Google Scholar]
- Gehrz, R. D., Truran, J. W., Williams, R. E., & Starrfield, S. 1998, PASP, 110, 3 [NASA ADS] [CrossRef] [Google Scholar]
- Giammichele, N., Charpinet, S., Fontaine, G., et al. 2018, Nature, 554, 73 [NASA ADS] [CrossRef] [Google Scholar]
- Glasner, S. A., & Livne, E. 1995, ApJ, 445, L149 [NASA ADS] [CrossRef] [Google Scholar]
- Glasner, S. A., Livne, E., & Truran, J. W. 1997, ApJ, 475, 754 [NASA ADS] [CrossRef] [Google Scholar]
- Glasner, S. A., Livne, E., & Truran, J. W. 2005, ApJ, 625, 347 [NASA ADS] [CrossRef] [Google Scholar]
- Glasner, S. A., Livne, E., & Truran, J. W. 2007, ApJ, 665, 1321 [NASA ADS] [CrossRef] [Google Scholar]
- Glasner, S. A., Livne, E., & Truran, J. W. 2012, MNRAS, 427, 2411 [NASA ADS] [CrossRef] [Google Scholar]
- Guo, Y., Liu, D., Wu, C., & Wang, B. 2021a, Res. Astron. Astrophys., 21, 034 [CrossRef] [Google Scholar]
- Guo, Y., Wu, C., & Wang, B. 2021b, MNRAS, 505, 2975 [NASA ADS] [CrossRef] [Google Scholar]
- Hachisu, I., & Kato, M. 2016, ApJ, 816, 26 [Google Scholar]
- Hachisu, I., Saio, H., Kato, M., Henze, M., & Shafter, A. W. 2020, ApJ, 902, 91 [NASA ADS] [CrossRef] [Google Scholar]
- Iijima, T. 2006, A&A, 451, 563 [NASA ADS] [CrossRef] [EDP Sciences] [Google Scholar]
- José, J. 2016, Stellar Explosions: Hydrodynamics and Nucleosynthesis (Boca Raton, FL: CRC/Taylor and Francis) [Google Scholar]
- José, J., & Hernanz, M. 1998, ApJ, 494, 680 [Google Scholar]
- José, J., Halabi, G. M., & El Eid, M. F. 2016, A&A, 593, A54 [NASA ADS] [CrossRef] [EDP Sciences] [Google Scholar]
- Kelly, K. J., Iliadis, C., Downen, L., José, J., & Champagne, A. 2013, ApJ, 777, 130 [NASA ADS] [CrossRef] [Google Scholar]
- Kippenhahn, R., & Thomas, H. C. 1978, A&A, 63, 265 [NASA ADS] [Google Scholar]
- Kutter, G. S., & Sparks, W. M. 1987, ApJ, 321, 386 [NASA ADS] [CrossRef] [Google Scholar]
- Liu, D., Wang, B., Wu, C., & Han, Z. 2017, A&A, 606, A136 [NASA ADS] [CrossRef] [EDP Sciences] [Google Scholar]
- Livio, M., & Truran, J. W. 1994, ApJ, 425, 797 [NASA ADS] [CrossRef] [Google Scholar]
- MacDonald, J. 1983, ApJ, 273, 289 [NASA ADS] [CrossRef] [Google Scholar]
- Morisset, C., & Pequignot, D. 1996, A&A, 312, 135 [NASA ADS] [Google Scholar]
- Paxton, B., Bildsten, L., Dotter, A., et al. 2011, ApJS, 192, 3 [Google Scholar]
- Paxton, B., Cantiello, M., Arras, P., et al. 2013, ApJS, 208, 4 [Google Scholar]
- Paxton, B., Marchant, P., Schwab, J., et al. 2015, ApJS, 220, 15 [Google Scholar]
- Paxton, B., Schwab, J., Bauer, E. B., et al. 2018, ApJS, 234, 34 [NASA ADS] [CrossRef] [Google Scholar]
- Petitjean, P., Boisson, C., & Pequignot, D. 1990, A&A, 240, 433 [NASA ADS] [Google Scholar]
- Politano, M., Starrfield, S., Truran, J. W., Weiss, A., & Sparks, W. M. 1995, ApJ, 448, 807 [NASA ADS] [CrossRef] [Google Scholar]
- Prialnik, D., & Kovetz, A. 1984, ApJ, 281, 367 [NASA ADS] [CrossRef] [Google Scholar]
- Rosner, R., Alexakis, A., Young, Y. N., Truran, J. W., & Hillebrandt, W. 2001, ApJ, 562, L177 [Google Scholar]
- Rukeya, R., Lü, G., Wang, Z., & Zhu, C. 2017, PASP, 129, 074201 [NASA ADS] [CrossRef] [Google Scholar]
- Siess, L. 2007, A&A, 476, 893 [NASA ADS] [CrossRef] [EDP Sciences] [Google Scholar]
- Starrfield, S., Truran, J. W., Wiescher, M. C., & Sparks, W. M. 1998, MNRAS, 296, 502 [NASA ADS] [CrossRef] [Google Scholar]
- Truran, J. W., & Livio, M. 1986, ApJ, 308, 721 [NASA ADS] [CrossRef] [Google Scholar]
- Umeda, H., Nomoto, K., Yamaoka, H., & Wanajo, S. 1999, ApJ, 513, 861 [NASA ADS] [CrossRef] [Google Scholar]
- Wang, B. 2018, Res. Astron. Astrophys., 18, 049 [Google Scholar]
- Wang, B., & Liu, D. 2020, Res. Astron. Astrophys., 20, 135 [CrossRef] [Google Scholar]
- Wang, B., Li, Y., Ma, X., et al. 2015, A&A, 584, A37 [NASA ADS] [CrossRef] [EDP Sciences] [Google Scholar]
- Wolf, W. M., Bildsten, L., Brooks, J., & Paxton, B. 2013, ApJ, 777, 136 [Google Scholar]
- Woosley, S. E. 1986, in Saas-Fee Advanced Course 16: Nucleosynthesis and Chemical Evolution, eds. J. Audouze, C. Chiosi, & S. E. Woosley, 1 [Google Scholar]
- Wu, C., Wang, B., Liu, D., & Han, Z. 2017, A&A, 604, A31 [NASA ADS] [CrossRef] [EDP Sciences] [Google Scholar]
- Yaron, O., Prialnik, D., Shara, M. M., & Kovetz, A. 2005, ApJ, 623, 398 [Google Scholar]
- Yungelson, L. R., & Kuranov, A. G. 2017, MNRAS, 464, 1607 [NASA ADS] [CrossRef] [Google Scholar]
All Tables
All Figures
|
Fig. 1. Elemental abundances (mass fraction) in nova ejecta vs. atomic number, in which we set the WD mixing fraction ≤40% and the WD mass to be 0.9 M⊙. Differently coloured lines represent different WD mixing fractions. |
| In the text | |
|
Fig. 2. Elemental abundance (mass fraction) ratios that may be candidates for the WD mixing meters vary with different He mixing degrees, in which we set the WD mass to be 0.7 M⊙ and the WD mixing fraction to be 20%. Panel a: results of (H + He)/∑ CNO and H/∑ CNO. Panel b: results of (H + He)/Ne and H/Ne. Panel c: results of ∑ CNO/Mg and ∑ CNO/Si. |
| In the text | |
|
Fig. 3. Peak temperature vs. the elemental abundance ratios that can be used to determine the WD mixing fraction, where the peak temperature corresponds to the WD mass in the range of 0.7−1.0 M⊙. Different colours represent different WD mixing fractions. Panel a: results of (H + He)/∑ CNO. Panel b: results of (H + He)/Ne. Panel c: results of ∑ CNO/Mg. Panel d: results of ∑ CNO/Si. |
| In the text | |
|
Fig. 4. WD mixing fractions in some representative classical novae determined by different elemental abundance ratios. Different marks represent the WD mixing degree from 10%−40%. The black stars refer to the observed data. The error bar represents the effect of the peak temperature on the elemental abundance ratios. Panel a: results of GQ Mus (Morisset & Pequignot 1996). Panel b: results of PW Vul (Andreä et al. 1994). Panel c: results of V842 Cen (Andreä et al. 1994). Panel d: results of V827 Her (Andreä et al. 1994). Panel e: results of V723 Cas (Iijima 2006). Panel f: Results of V2214 Oph (Andreä et al. 1994). |
| In the text | |
|
Fig. 5. Relation between t2 and the metallicity in nova ejecta (Z), in which these novae are listed in Gehrz et al. (1998). We only selected classical novae that show significant signs of the WD mixing (Z > 0.1). t2 is the time of decline by two magnitudes from peak brightness, which can be directly derived from the observations. |
| In the text | |
|
Fig. 6. Relation between t2 and the value of Ne/Z obtained from some classical novae, in which these novae show obvious signs of WD mixing (Z > 0.1). |
| In the text | |
Current usage metrics show cumulative count of Article Views (full-text article views including HTML views, PDF and ePub downloads, according to the available data) and Abstracts Views on Vision4Press platform.
Data correspond to usage on the plateform after 2015. The current usage metrics is available 48-96 hours after online publication and is updated daily on week days.
Initial download of the metrics may take a while.