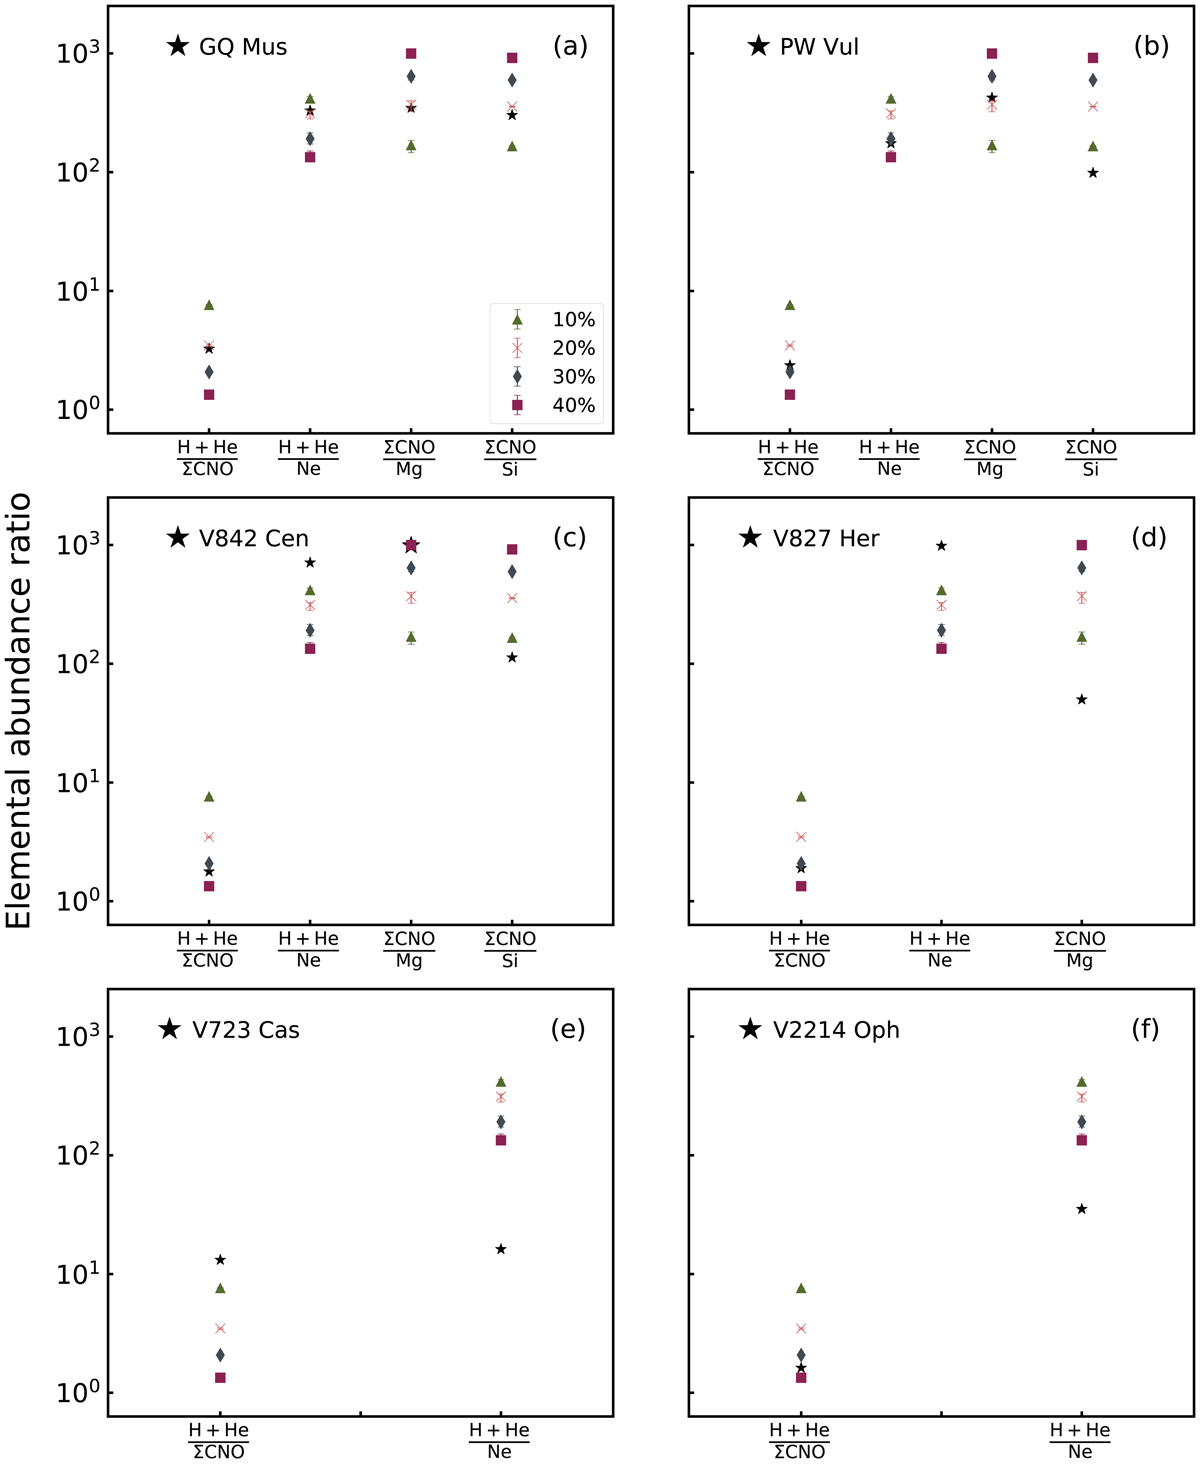
Fig. 4.
Download original image
WD mixing fractions in some representative classical novae determined by different elemental abundance ratios. Different marks represent the WD mixing degree from 10%−40%. The black stars refer to the observed data. The error bar represents the effect of the peak temperature on the elemental abundance ratios. Panel a: results of GQ Mus (Morisset & Pequignot 1996). Panel b: results of PW Vul (Andreä et al. 1994). Panel c: results of V842 Cen (Andreä et al. 1994). Panel d: results of V827 Her (Andreä et al. 1994). Panel e: results of V723 Cas (Iijima 2006). Panel f: Results of V2214 Oph (Andreä et al. 1994).
Current usage metrics show cumulative count of Article Views (full-text article views including HTML views, PDF and ePub downloads, according to the available data) and Abstracts Views on Vision4Press platform.
Data correspond to usage on the plateform after 2015. The current usage metrics is available 48-96 hours after online publication and is updated daily on week days.
Initial download of the metrics may take a while.