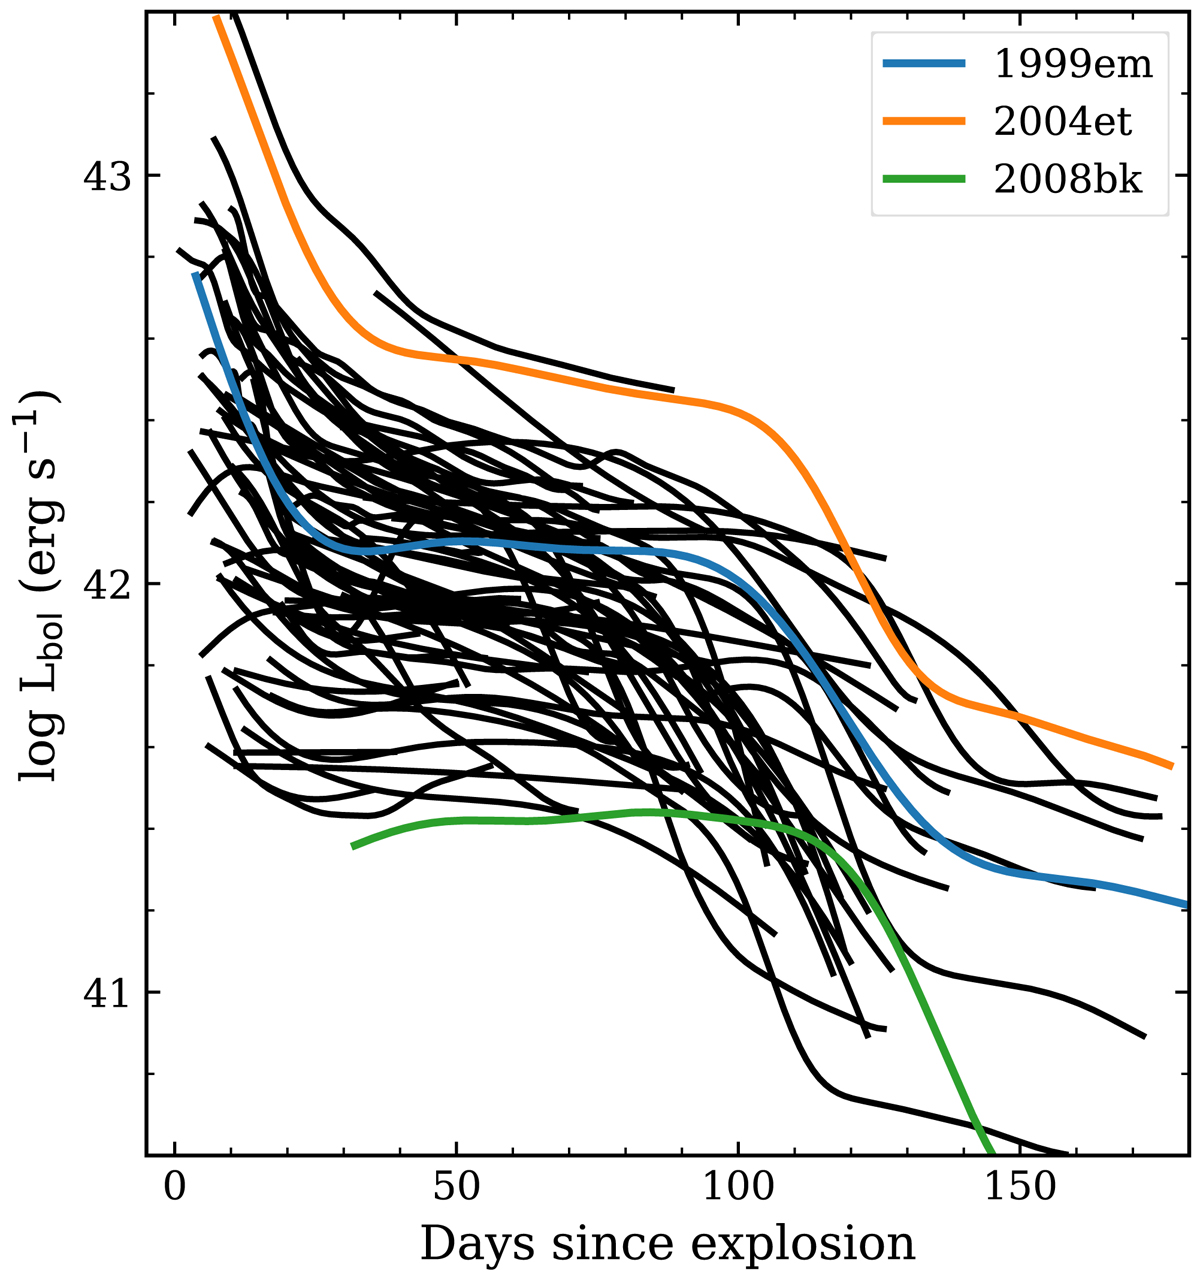
Fig. 6.

Download original image
Bolometric LCs of the CSP-I SN II sample. LCs are re-sampled via Gaussian processes for better visualisation, and displayed by black lines. For comparison, we show in colours three well-studied SNe II: 1999em (Bersten & Hamuy 2009), 2004et (Martinez et al. 2020), and 2008bk (this work). Only SNe II with explosion epochs estimates are shown.
Current usage metrics show cumulative count of Article Views (full-text article views including HTML views, PDF and ePub downloads, according to the available data) and Abstracts Views on Vision4Press platform.
Data correspond to usage on the plateform after 2015. The current usage metrics is available 48-96 hours after online publication and is updated daily on week days.
Initial download of the metrics may take a while.


