Fig. 4.
Download original image
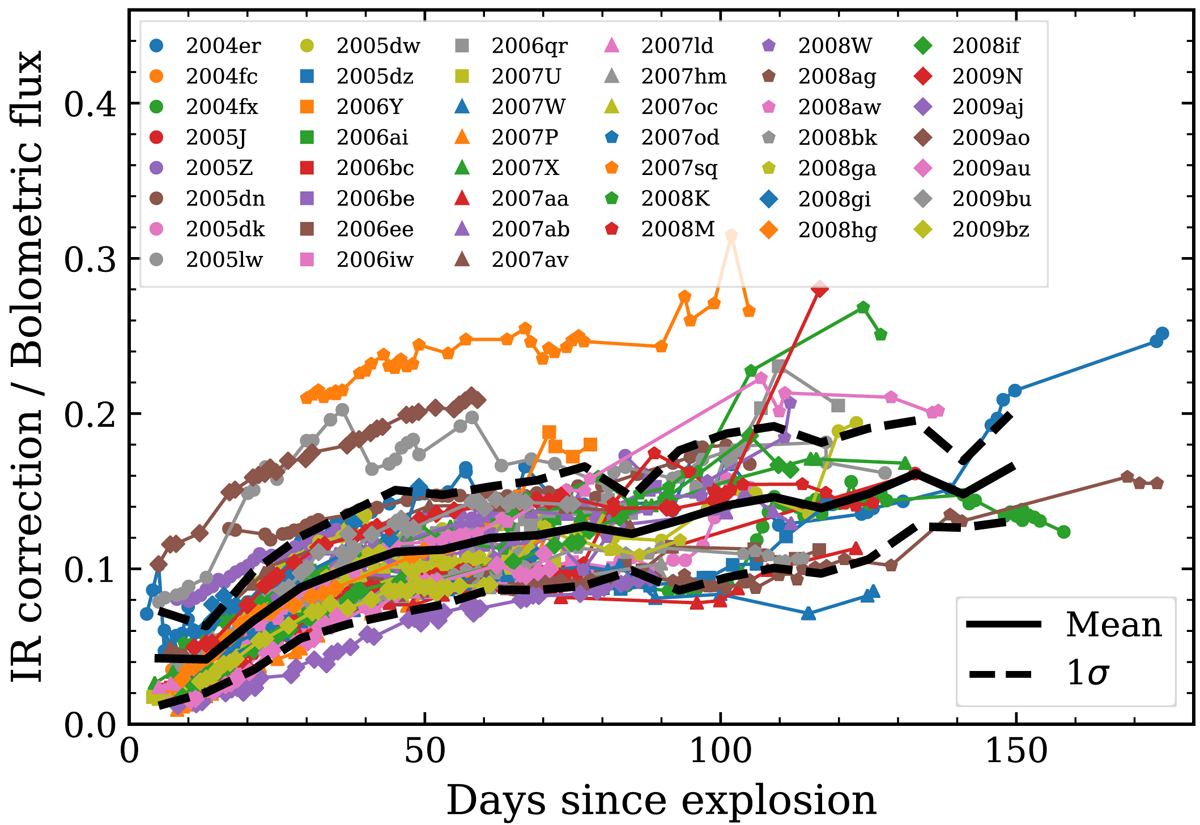
Fraction of the IR correction over the bolometric flux as a function of time. The black solid line indicates the mean values within each time bin, while the dashed lines represent the standard deviation. We only include SNe II with observed YJH photometry. Three SNe II (SNe 2005lw, 2007sq and 2009ao) display unusual values beyond 2σ from the mean. This may be due to a significant uncorrected reddening in the host galaxy (see text).
Current usage metrics show cumulative count of Article Views (full-text article views including HTML views, PDF and ePub downloads, according to the available data) and Abstracts Views on Vision4Press platform.
Data correspond to usage on the plateform after 2015. The current usage metrics is available 48-96 hours after online publication and is updated daily on week days.
Initial download of the metrics may take a while.