Fig. 3.
Download original image
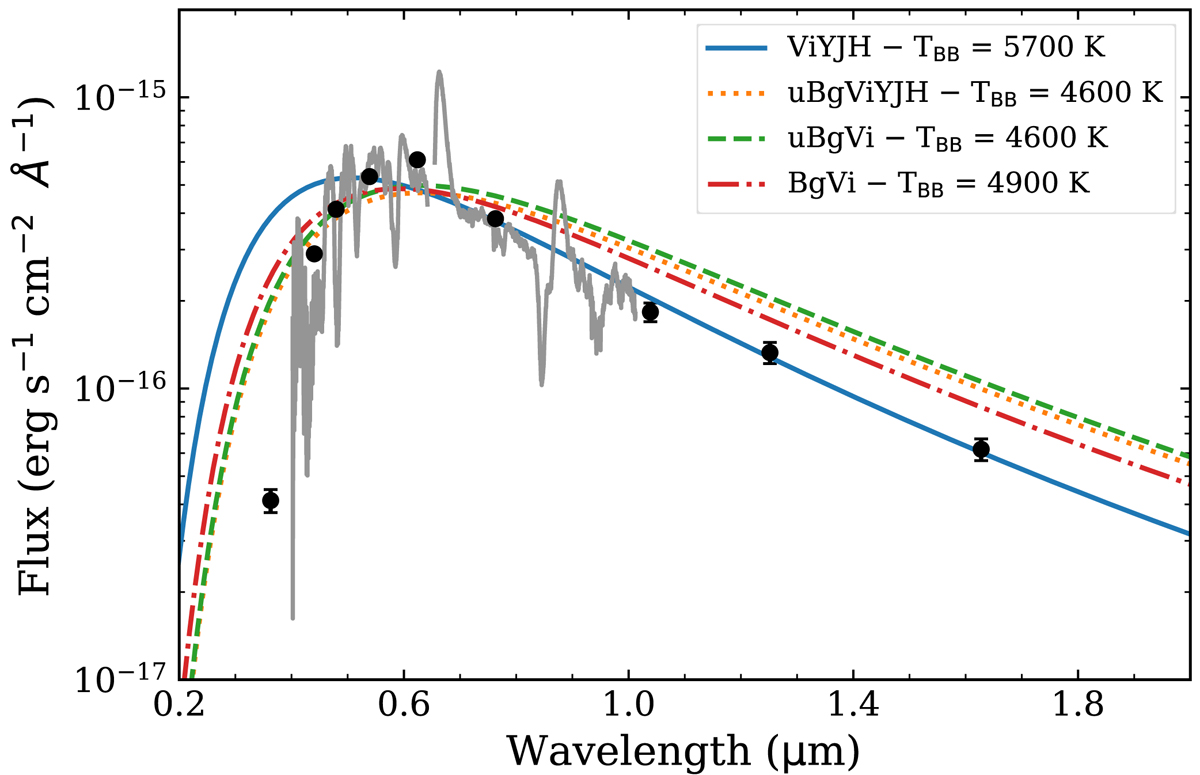
BB fits for SN 2008if at 72 days after explosion. Different linestyles and colours correspond to different set of bands used for the fitting process. The blue solid line is the optimal model since data affected by line blanketing (u, B, and g bands) are removed from the fit. The best-fitting BB temperatures (TBB) are indicated in the legend. An optical spectrum taken at 70 days after explosion is presented in grey. It shows that Hα line profile produces an increment of the r-band flux above the BB model.
Current usage metrics show cumulative count of Article Views (full-text article views including HTML views, PDF and ePub downloads, according to the available data) and Abstracts Views on Vision4Press platform.
Data correspond to usage on the plateform after 2015. The current usage metrics is available 48-96 hours after online publication and is updated daily on week days.
Initial download of the metrics may take a while.