Fig. C.2.
Download original image
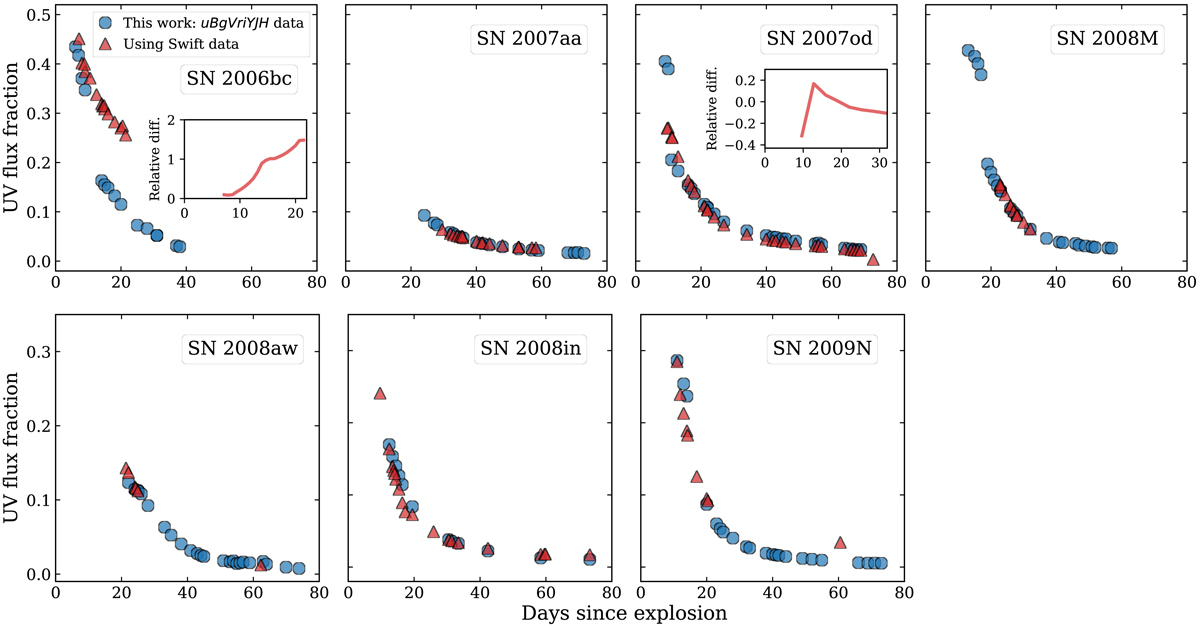
UV flux fraction as a function of time for the SNe II in the CSP-I sample with available Swift-UV observations. Blue dots represent our UV extrapolation method to account for the unobserved flux at shorter wavelengths than u band, while red triangles consider red-leak corrected Swift-UV data. For the cases of SN 2006bc and SN 2007od the relative differences between both UV fractions are shown since these two SNe II present the largest differences.
Current usage metrics show cumulative count of Article Views (full-text article views including HTML views, PDF and ePub downloads, according to the available data) and Abstracts Views on Vision4Press platform.
Data correspond to usage on the plateform after 2015. The current usage metrics is available 48-96 hours after online publication and is updated daily on week days.
Initial download of the metrics may take a while.