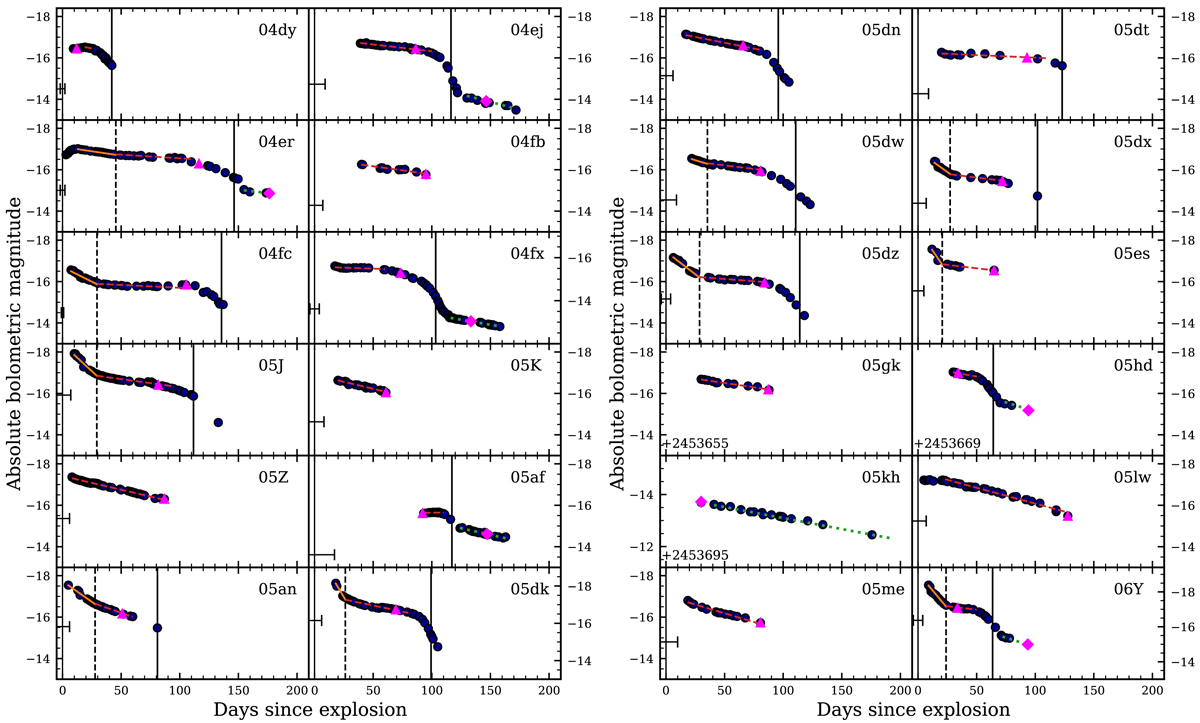
Fig. B.2.
Download original image
Absolute bolometric LCs of SNe II in our sample. The panels present SNe in order of their discovery dates, from SN 2004dy to SN 2006Y. Bolometric luminosities are presented as blue dots. The errors are not plotted for better visualisation, but in general they are small. Measured bolometric LC parameters are also presented: Mbol, end as magenta triangles, Mbol, tail as magenta diamonds, s1 as solid orange lines, s2 as dashed red lines, s3 as dotted green lines, tPT as thick vertical black lines, and ttrans as dashed vertical black lines. Thin vertical black lines show the explosion epoch and its uncertainty. SNe 2005gk, 2005hd, and 2005kh do not show this line because they have no explosion epoch estimation.
Current usage metrics show cumulative count of Article Views (full-text article views including HTML views, PDF and ePub downloads, according to the available data) and Abstracts Views on Vision4Press platform.
Data correspond to usage on the plateform after 2015. The current usage metrics is available 48-96 hours after online publication and is updated daily on week days.
Initial download of the metrics may take a while.