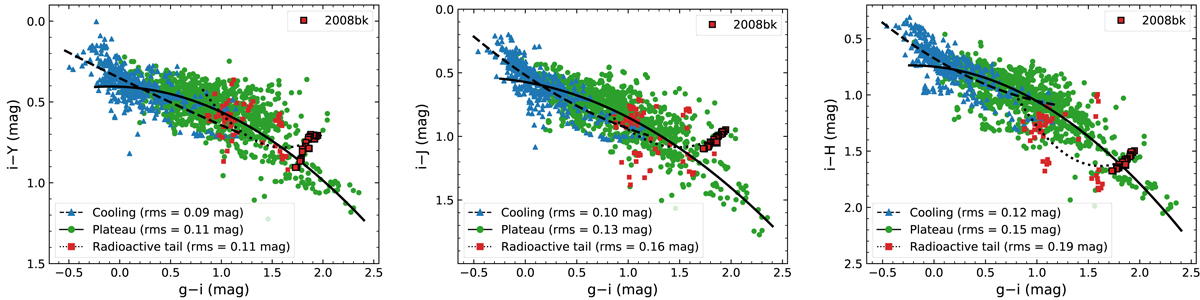
Fig. B.1.
Download original image
Colour-colour diagrams when separating the sample into three epochs: cooling (blue triangles), plateau (green dots), and radioactive tail phase (red squares). All measurements were first corrected for Milky Way extinction. The solid line indicates the polynomial fit to the plateau phase data, while dashed and dotted lines to the cooling and radioactive tail phases, respectively.
Current usage metrics show cumulative count of Article Views (full-text article views including HTML views, PDF and ePub downloads, according to the available data) and Abstracts Views on Vision4Press platform.
Data correspond to usage on the plateform after 2015. The current usage metrics is available 48-96 hours after online publication and is updated daily on week days.
Initial download of the metrics may take a while.