Fig. 13.
Download original image
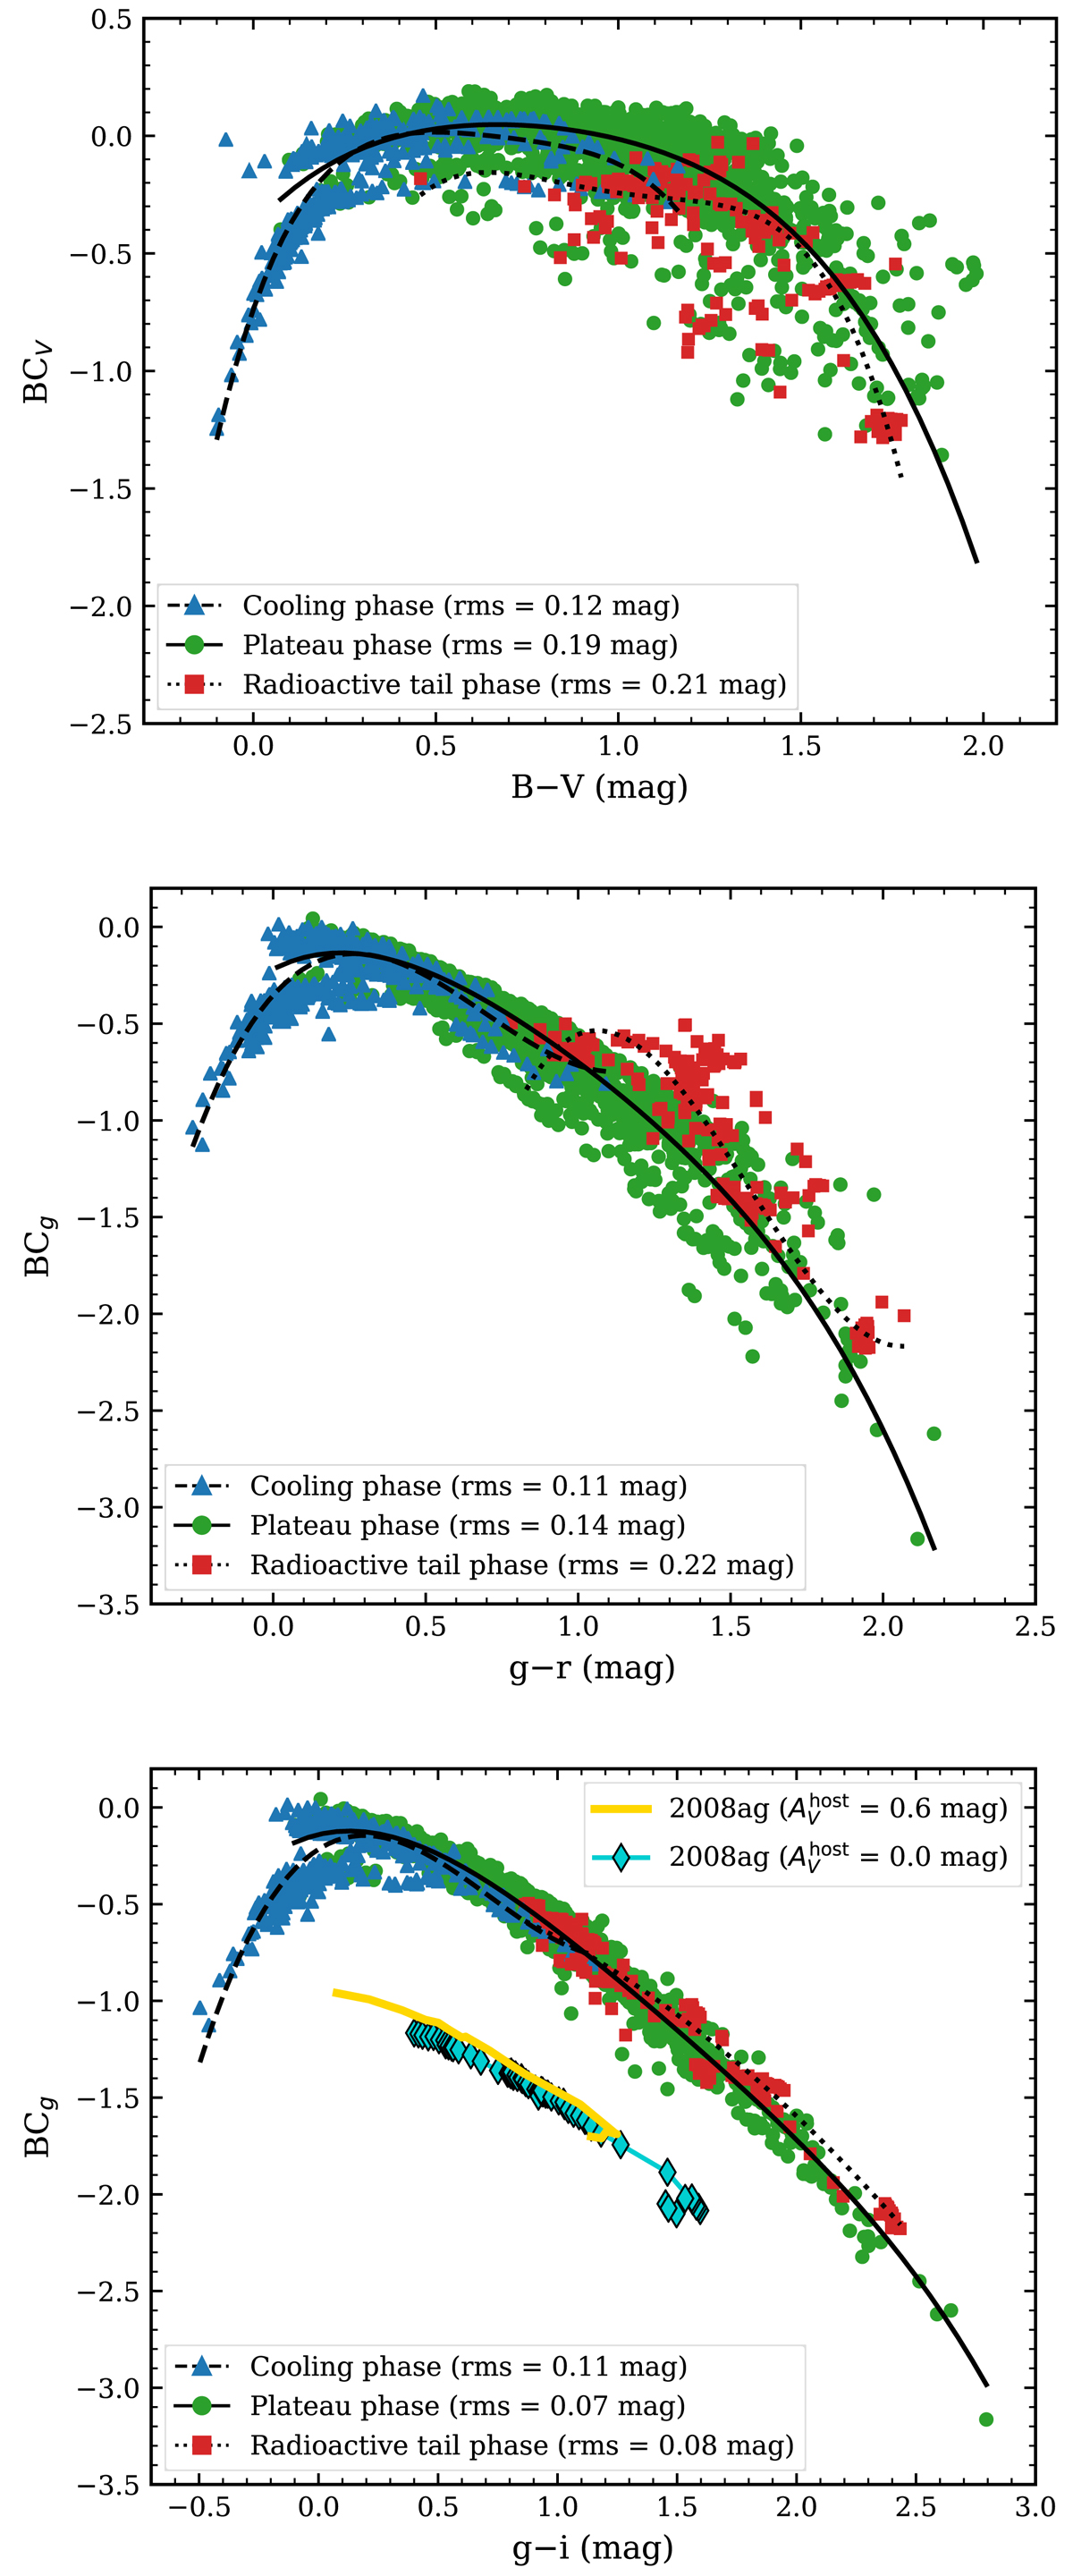
Bolometric corrections to the V band as a function of B − V colour (top panel), and to the g band as a function of g − r colour (middle panel) and g − i colour (bottom panel) for all SNe II in the sample. The data and fits are separated into three epochs: cooling phase (blue triangles, dashed line), plateau phase (green dots, solid line), and radioactive tail phase (red squared, dotted line). The bottom panel also shows the effect of reddening in this plot by re-analysing SN 2008ag with ![]() = 0.6 mag. Both curves for SN 2008ag are offset from the data for visualisation purposes.
= 0.6 mag. Both curves for SN 2008ag are offset from the data for visualisation purposes.
Current usage metrics show cumulative count of Article Views (full-text article views including HTML views, PDF and ePub downloads, according to the available data) and Abstracts Views on Vision4Press platform.
Data correspond to usage on the plateform after 2015. The current usage metrics is available 48-96 hours after online publication and is updated daily on week days.
Initial download of the metrics may take a while.