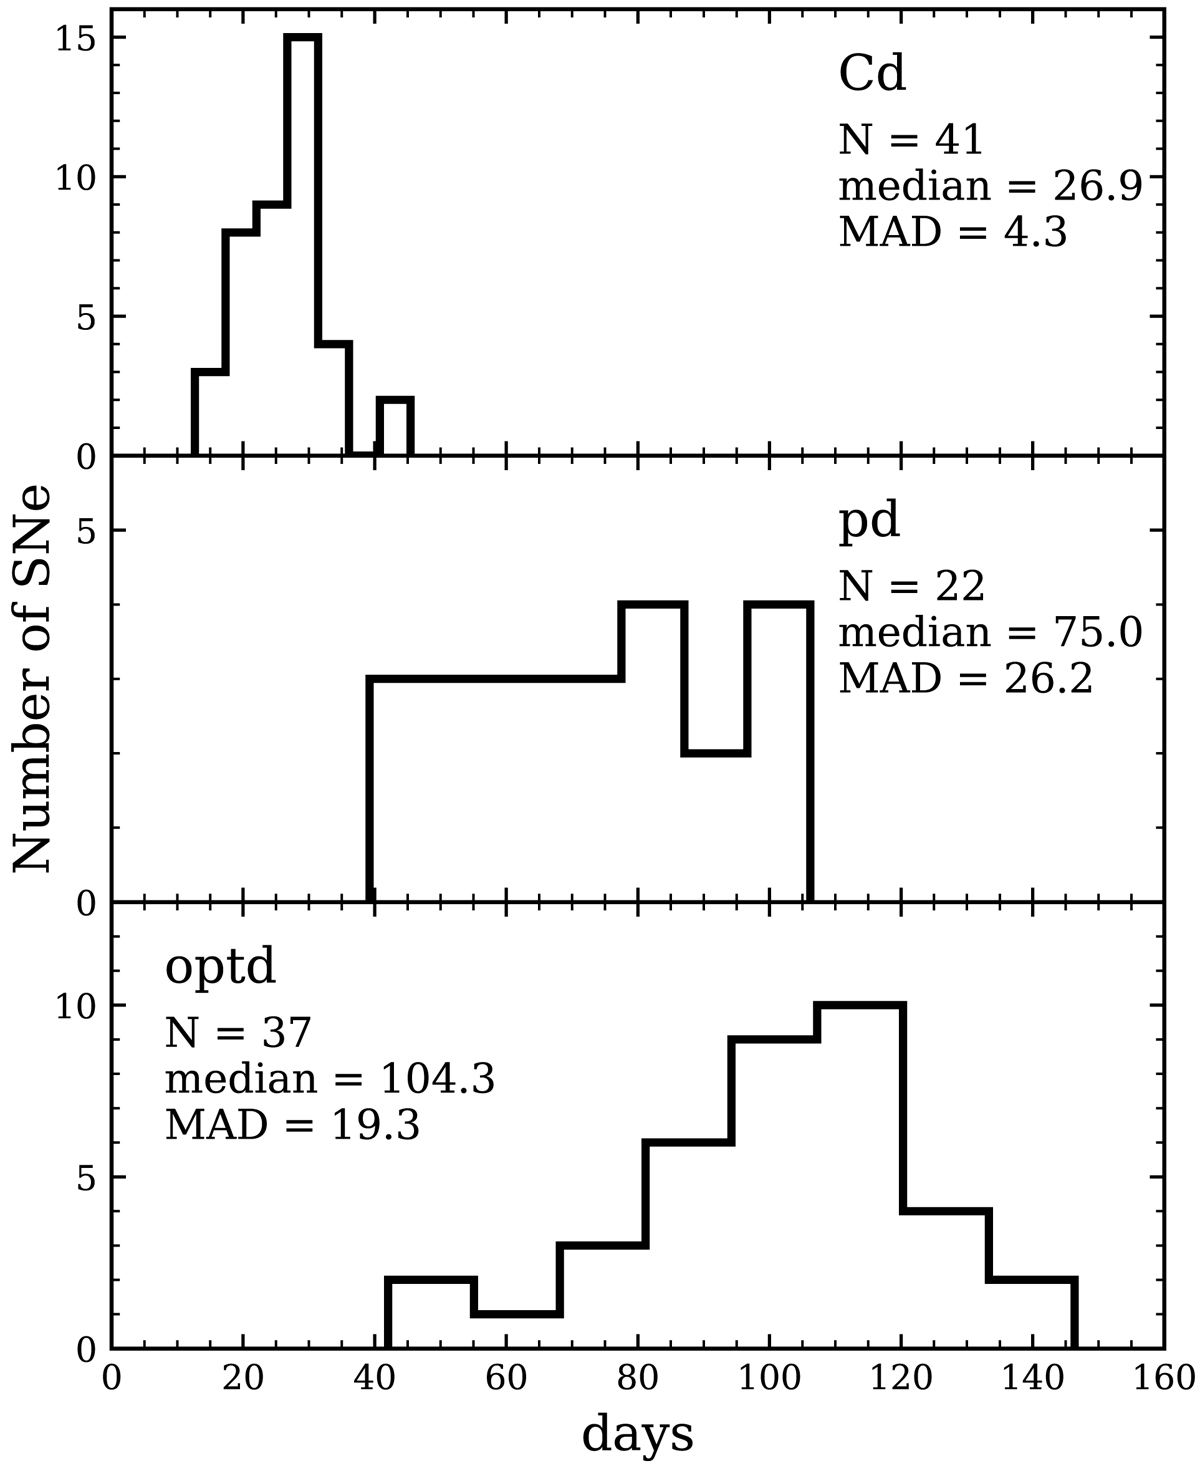
Fig. 11.
Download original image
Histograms of the three measured time durations of SNe II. Top panel: duration of the cooling phase (Cd). Middle panel: duration of the plateau phase (pd). Bottom panel: duration of the optically-thick phase (optd). In each panel, the number of SNe II (N) is listed, together with the median and the median absolute deviation (MAD).
Current usage metrics show cumulative count of Article Views (full-text article views including HTML views, PDF and ePub downloads, according to the available data) and Abstracts Views on Vision4Press platform.
Data correspond to usage on the plateform after 2015. The current usage metrics is available 48-96 hours after online publication and is updated daily on week days.
Initial download of the metrics may take a while.