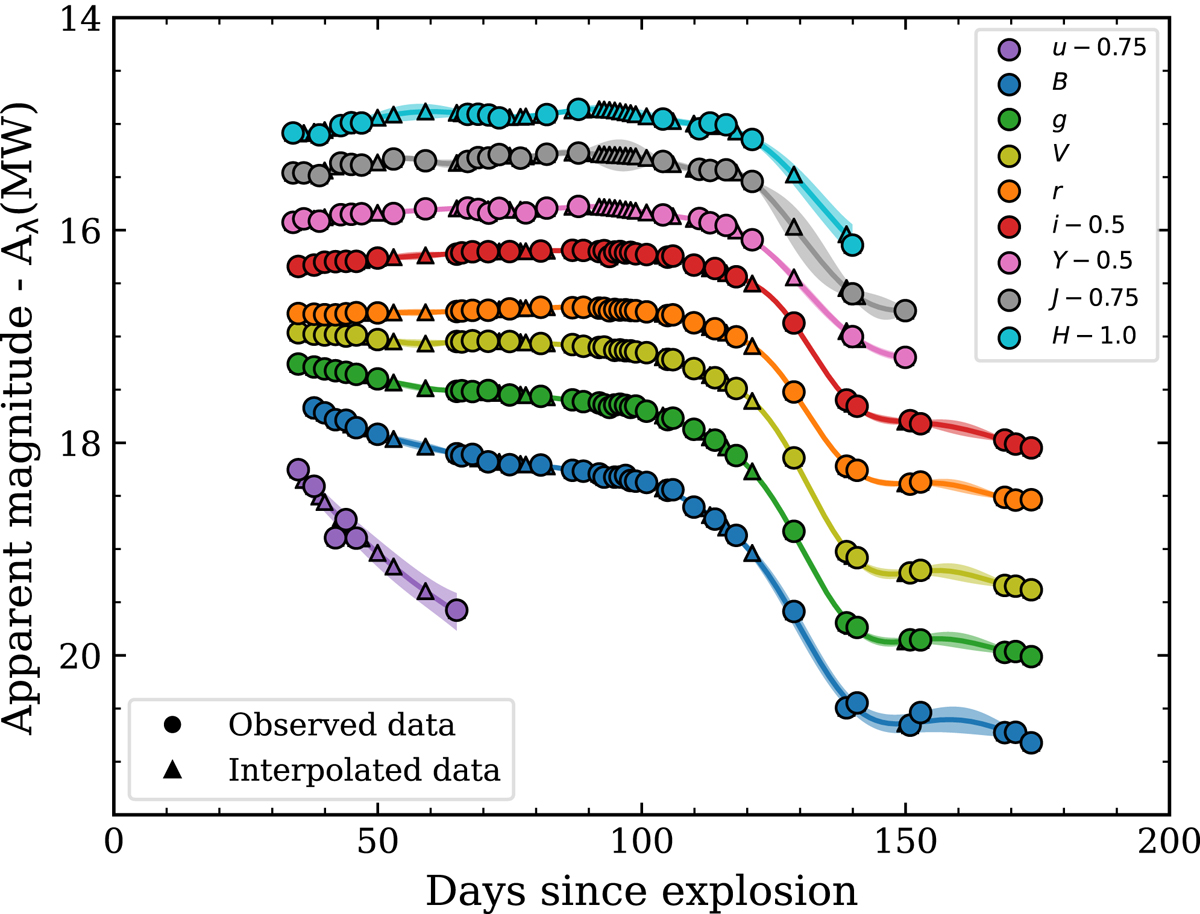
Fig. 1.
Download original image
Optical and NIR LCs of SN 2008ag corrected by Milky Way extinction. The dots are the observed data and the triangles are the interpolated magnitudes. Solid lines are the re-sampled LCs via Gaussian processes and the shaded regions represent the 95% confidence intervals of the interpolation. The error bars of the observed magnitudes are smaller than the dot size.
Current usage metrics show cumulative count of Article Views (full-text article views including HTML views, PDF and ePub downloads, according to the available data) and Abstracts Views on Vision4Press platform.
Data correspond to usage on the plateform after 2015. The current usage metrics is available 48-96 hours after online publication and is updated daily on week days.
Initial download of the metrics may take a while.