| Issue |
A&A
Volume 659, March 2022
|
|
|---|---|---|
| Article Number | L8 | |
| Number of page(s) | 5 | |
| Section | Letters to the Editor | |
| DOI | https://doi.org/10.1051/0004-6361/202142972 | |
| Published online | 23 March 2022 | |
Letter to the Editor
Discovery of a new molecular ion, HC7NH+, in TMC-1⋆
1
Grupo de Astrofísica Molecular, Instituto de Física Fundamental (IFF-CSIC), C/ Serrano 121, 28006 Madrid, Spain
e-mail: This email address is being protected from spambots. You need JavaScript enabled to view it.
, This email address is being protected from spambots. You need JavaScript enabled to view it.
2
Observatorio Astronómico Nacional (IGN), C/ Alfonso XII, 3, 28014 Madrid, Spain
3
Centro de Desarrollos Tecnológicos, Observatorio de Yebes (IGN), 19141 Yebes, Guadalajara, Spain
Received:
21
December
2021
Accepted:
6
March
2022
Abstract
We report the detection of the protonated form of HC7N in TMC-1. The discovery of the cation HC7NH+ was carried out via the observation of nine harmonically related lines in the Q-band using the Yebes 40 m radiotelescope. The observed frequencies allowed us to obtain the rotational constants B0 = 553.938802 (160) MHz and D0 = 3.6292 (705) Hz. The identification of HC7NH+ is further supported by accurate ab initio calculations. We derived a column density of (5.5 ± 0.7) × 1010 cm−2, which constitutes another piece of evidence for the identification of the carrier. In addition, we revised the HC7N column density and we derived a new value of (2.1 ± 0.2) × 1013 cm−2. Hence, the abundance ratio HC7N/HC7NH+ is ∼380, while those for HC3N/HC3NH+ and HC5N/HC5NH+ are ∼230 and ∼240, respectively. Here, we discuss these results within the framework of a chemical model for protonated molecules in cold dense clouds.
Key words: astrochemistry / ISM: molecules / ISM: individual objects: TMC-1 / line: identification / molecular data
Based on observations carried out with the Yebes 40 m telescope (projects 19A003, 20A014, 20D023, and 21A011). The 40 m radiotelescope at Yebes Observatory is operated by the Spanish Geographic Institute (IGN, Ministerio de Transportes, Movilidad y Agenda Urbana).
© ESO 2022
1. Introduction
The cold dark cloud TMC-1 shows a rich and complex chemistry that leads to the formation of a great variety of molecules. Among them, the unsaturated carbon chains, including cyanopolyynes, acetylenic free radicals, and cumulene carbenes stand out as the most prevalent type of molecules (Agúndez & Wakelam 2013). It was recently discovered that TMC-1 also contains a plethora of carbon-based molecules of considerable complexity such as the partially saturated carbon chains C5H4 (Cernicharo et al. 2021a) and C6H3N (Shingledecker et al. 2021), the aromatic cycle benzyne (Cernicharo et al. 2021b), and polycyclic aromatic molecules like indene (Cernicharo et al. 2021c; Burkhardt et al. 2021), C6H5CN (McGuire et al. 2018), and C10H7CN (McGuire et al. 2021).
Another distinctive aspect of TMC-1 is the presence of protonated species of abundant neutral molecules. The list of protonated molecular species found here consists of the widespread HCO+ and N2H+, such as HCS+ (Irvine et al. 1983),  (Turner et al. 1999), and the more recently discovered species HC3O+ (Cernicharo et al. 2020a), HC3S+ (Cernicharo et al. 2021d), CH3CO+ (Cernicharo et al. 2021e), and HCCS+ (Cabezas et al. 2022a). The list is completed by the protonated nitriles HCNH+ (Schilke et al. 1991), HC3NH+ (Kawaguchi et al. 1994), NCCNH+ (Agúndez et al. 2015), and HC5NH+ (Marcelino et al. 2020), which are observed in TMC-1 because their neutral counterparts are abundant and have high proton affinities. The abundance ratio between a protonated molecule and its neutral counterpart, [MH+]/[M], is sensitive to the degree of ionization and thus to various physical parameters of the cloud, and it is mainly set by the rates of formation and destruction of the cation (Agúndez et al. 2015). The protonated form is mainly formed by proton transfer to the neutral and destroyed by dissociative recombination with electrons. It is interesting to note that both chemical models and observations suggest a trend in which the abundance ratio [MH+]/[M] increases with the increasing proton affinity of M (Agúndez et al. 2015).
The proton affinities of the nitriles whose protonated species have been detected in TMC-1 are between 674.7 kJ mol−1 (for NCCN; Hunter & Lias 1998) and 770 ± 20 kJ mol−1 (for HC5N; Edwards et al. 2009). These values are larger than the proton affinities of molecules such as CO or N2 and smaller than those of C3O or C3S. For cyanopolyynes, the longer the carbon chain, the higher the proton affinity. That is, for HCN, HC3N, and HC5N, the proton affinities are 712.9, 751.2, and 770 kJ mol−1, respectively (Hunter & Lias 1998; Edwards et al. 2009). Hence, larger members of the series of cyanopolyynes are potential candidates to be detected in their protonated form. One of them is HC7N, which is only two times less abundant than HC5N in TMC-1 (Cernicharo et al. 2020b). However, laboratory microwave spectroscopy information that allow for the astronomical identification of these protonated species is not available. The use of high-level quantum chemical calculations is a powerful alternative with which we may overcome the lack of laboratory experimental data on transient molecules such as protonated species. The combination of accurate calculations with high-resolution line surveys can be used to carry out molecular spectroscopy in space, allowing for the detection of elusive molecular species. In the recent years, we have employed this method to identify, in space, MgC3N and MgC4H (Cernicharo et al. 2019), HC5NH+ (Marcelino et al. 2020), MgC5N and MgC6H (Pardo et al. 2021), H2NC (Cabezas et al. 2021a), CH2DC3N (Cabezas et al. 2021b), HCCS+ (Cabezas et al. 2022a), and CH2DC4H (Cabezas et al. 2022b). Here, we present a new case of molecular spectroscopy carried out in space. Thanks to the sensitivity of our QUIJOTE1 line survey of TMC-1 (Cernicharo et al. 2021b), we have detected a new series of harmonically related lines belonging to a molecule with a 1Σ ground electronic state. Based on ab initio calculations and the expected intensities of the lines for all the plausible molecular candidates, we have confidently assigned the observed lines to HC7NH+.
2. Observations
The data presented in this work are part of the QUIJOTE spectral line survey Cernicharo et al. (2021b) in the Q band towards TMC-1(CP) (αJ2000 = 4h 41m 41.9s and δJ2000 = +25° 41′ 27.0″) that was performed at the Yebes 40 m radio telescope during various observing sessions between November 2019 and January 2022. The survey was done using new receivers, built within the Nanocosmos project2 and consisting of two cooled high electron mobility transistor (HEMT) amplifiers covering the 31.0−50.3 GHz band with horizontal and vertical polarizations. Fast Fourier transform spectrometers (FFTSs) with 8 × 2.5 GHz with a spectral resolution of 38.15 kHz provide the whole coverage of the Q-band in both polarizations. This setup has been described previously in Tercero et al. (2021). The QUIJOTE observations are performed using the frequency-switching observing mode with a frequency throw of 10 MHz in the very first observing runs, during November 2019 and February 2020, 8 MHz during observations taking place between January–November 2021, and 10 MHz again in the last observing run between October 2021 and January 2022. After including all of the data, the total on-source telescope time is 430 h in each polarization (twice this value after averaging the two polarizations). This observing time can be split into 200 and 230 h for the 8 MHz and 10 MHz frequency throws. The main beam efficiency of the Yebes 40 m telescope varies from 0.6 at 32 GHz to 0.43 at 50 GHz.
The intensity scale used in this work, antenna temperature ( ), was calibrated using two absorbers at different temperatures and the atmospheric transmission model ATM (Cernicharo 1985; Pardo et al. 2001). Calibration uncertainties were assumed to be 10% based on the observed repeatability of the line intensities between different observing runs. All data were analyzed using the GILDAS package3.
3. Results
The level of sensitivity of our QUIJOTE line survey is now three to four times better than that used for the detection of HC5NH+ (Marcelino et al. 2020). Due to the high abundance of HC7N in TMC-1, it is expected that its protonated form, HC7NH+, can be detected within the forest of lines with an intensity of ≤2 mK that remain unassigned in our line survey. The molecular parameters for HC7NH+ have been estimated by Botschwina et al. (1997) using accurate ab initio calculations. We used these parameters to predict the rotational transition frequencies for HC7NH+ in the Q-band. Following these predictions, we found a series of nine harmonically related lines ∼25 MHz above the expected frequencies. The observed lines are shown in Fig. 1, whose frequencies and line parameters are given in Table 1. By fitting the observed frequencies to the standard expression for a linear molecule ν(J → J − 1) = 2B0J − 4D0J3 in the 1Σ electronic state, we derived the rotational parameters shown in the first column of Table 2. The derived value for the B0 rotational constant agrees well with that predicted by Botschwina et al. (1997), 553.8 MHz. However, in their paper, Botschwina et al. (1997) do not provide any estimation for the centrifugal distortion constant, D.
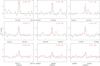 |
Fig. 1. Observed lines of HC7NH+ in TMC-1 in the 31.0−50.4 GHz range. Frequencies and line parameters are given in Table 1. Quantum numbers for the observed transitions are indicated in each panel. The red line shows the synthetic spectrum computed for a rotational temperature of 8.5 K and a column density of 5.5 × 1010 cm−2 (see text). Blanked channels correspond to negative features created in the folding of the frequency switching data. The label U corresponds to unidentified features above 4σ. |
Observed line parameters for HC7NH+ in TMC-1.
In addition to HC7NH+, the most promising candidates for acting as the carrier for the observed lines are HC7O+ and NC6NH+. The B rotational constant for C7O is 572.94105 MHz, so its protonated form is expected to have a B value similar to that derived from our TMC-1 data. For NC6N, there are no experimental data available in the literature, but the B value for NC6NH+ should be on the order of that for HC7NH+ and HC7O+, as it occurs for the smaller members HC5NH+, NC4NH+, and HC5O+ (Marcelino et al. 2020). Other molecules that could be considered as candidates are H2C7O, H2C7O+, and H2C8. However, no additional lines corresponding to Ka = 1 transitions were observed at higher and lower frequencies from this series, which excludes these near-prolate molecules as plausible carriers of the observed lines. Moreover, H2C8 can be discarded because its K = 0 effective rotational constant for H2C8 is 574.2267 (4) MHz (Apponi et al. 2000), and H2C7O is predicted (McCarthy et al. 2017) to have much smaller rotational constants B and C, 517.0 and 516.1 MHz, respectively, while H2C7O+ is an open-shell species and its rotational spectrum will display a complicated hyperfine structure.
To obtain accurate spectroscopic parameters, we performed ab initio calculations for HC7NH+, HC7O+, and NC6NH+ and also for HC7N and C7O species for which the rotational parameters are experimentally determined. In this manner, we can scale the calculated values for the target species using experimental/theoretical ratios derived for the related species. This procedure has been found to provide rotational constants with an accuracy better than 0.1% (e.g. Cabezas et al. 2021a). We chose HC7N and C7O as reference species to scale the HC7NH+ and HC7O+ calculations. The theoretical values for NC6NH+ are not scaled because there is not any similar and isoelectronic species for which the rotational parameters are experimentally determined. The geometry optimization calculations for all the species were done using the coupled cluster method with single, double, and perturbative triple excitations with an explicitly correlated approximation (CCSD(T)-F12; Knizia et al. 2009) and all electrons (valence and core) correlated together with the Dunning’s correlation consistent basis sets with polarised core-valence correlation triple-ζ for explicitly correlated calculations (cc-pCVTZ; Hill et al. 2010). These calculations were carried out using the Molpro 2020.2 program (Werner et al. 2020). The values for the centrifugal distortion constants and the vibration-rotation interaction constants were obtained using harmonic and anharmonic vibrational frequency calculations, respectively, with the second-order Møller–Plesset perturbation theory method (MP2; Møller & Plesset 1934) and the correlation consistent with polarised valence triple-ζ basis set (cc-pVTZ; Woon & Dunning 1993). These calculations were carried out using the Gaussian09 program (Frisch et al. 2013). The results obtained are presented in Table 2. The values for the Be constant come from geometry optimization calculations and those for the D constant and the vibration-rotation corrections are taken from frequency calculations. The B0 values are the sum of Be and the vibration-rotation correction terms. The values of B0 and D calculated for HC7NH+ and HC7O+ were then scaled by the corresponding experimental/calculated ratios obtained for HC7N and C7O, respectively.
Theoretical spectroscopic parameters for the different molecular candidates for the observed lines in TMC-1 (all in MHz).
4. Discussion
4.1. Identification of the carrier
Our comparison of the calculated and experimental rotational constants for HC7N and C7O species reveals the good accuracy of the ab initio calculations employed. The differences between the calculated B0 values and the experimental ones reach 0.08% and 0.03% for HC7N and C7O, respectively. Hence, similar discrepancies should be expected between the B0 value derived from our fit and the calculated B0 value for the carrier species. The data from Table 2 show differences of 0.06%, 0.94%, and 0.26% for HC7NH+, NC6NH+, and HC7O+, respectively, which indicates that the observed species in TMC-1 is HC7NH+. When the scaled values are compared, the calculation errors decrease down to 0.02% for HC7NH+, while for HC7O+ it is still high, 0.23%, which confirms HC7NH+ as the carrier of the observed lines. The fact that the B0 constant for NC6NH+ cannot be scaled is irrelevant because the error of the calculated value is almost ten times larger than the expected one for this type of calculation, which rules out NC6NH+ as a possible candidate. Another spectroscopic argument that supports the detection of HC7NH+ is the good agreement found for the centrifugal distortion constant, D. The scaled value for HC7NH+ perfectly reproduces the D value derived from the fit, while that of HC7O+ is ∼25% larger. Hence, our ab initio calculations provide conclusive arguments for the spectroscopic identification of HC7NH+ using our TMC-1 survey.
Another point supporting this assignment concerns the very different dipole moment of HC7NH+ and HC7O+. While HC7NH+ has a predicted dipole moment of ∼6.4 D, the corresponding value for HC7O+ is ∼1.7 D, hence, the abundance resulting from the observed line intensities would be significantly different if the carrier is one or the other species. An analysis of the line intensities through a line model-fitting procedure (Cernicharo et al. 2021c), assuming that the carrier is HC7NH+, provides a rotational temperature of ∼8.5 ± 1.5 K and a column density of N(HC7NH+) = (5.5 ± 0.7) × 1010 cm−2. When HC7O+ is assumed as the line carrier, the column density obtained is N(HC7O+) = (7.1 ± 0.6) × 1011 cm−2. As previously discussed by Agúndez et al. (2015), in cold dense clouds, protonated molecules MH+ are formed mainly by reactions of proton transfer from a proton donor XH+, which is usually HCO+, H3O+, or  , to M, namely:
 (1)
(1)
The column density of HC7N in TMC-1 was found to be (6.4 ± 0.4) × 1013cm−2 (Cernicharo et al. 2020b). This value was derived from observations of fourteen transitions from J = 28−27 up to J = 44−43. These observations correspond to the first observing run in 2020. We have revised these results taking into account the new data gathered until January 2022. In these new estimations we have assumed a source of uniform brightness and 80″ in diameter (Fossé et al. 2001). We derive now a column density for HC7N of (2.1 ± 0.2) × 1013 cm−2, and Trot = 7.6 ± 0.2 K. The previous estimate of N(HC7N) was unfortunately affected by an erroneous assumption of the source diameter (40″ instead of the value adopted in the QUIJOTE line survey of 80″). Hence, the HC7N/HC7N+ abundance ratio is ∼380. A correct estimation of the column density will require a measure of the source size in order to compute the beam dilution of each line, which could affect the derived rotational temperatures.
On the other hand, while C5O was recently discovered in TMC-1 (Cernicharo et al. 2021f), the longest carbon chain C7O has not been observed in TMC-1 and the derived upper limit to its column density using the QUIJOTE line survey is ≤2.0 × 1010 cm−2, which would result in a ratio of C7O/HC7O+ ≤ 0.04. A neutral-to-protonated ratio lower than one seems extremely unlikely. In light of this fact and the spectroscopic evidence mentioned before we definitively conclude that the carrier of the unidentified lines observed in TMC-1 is HC7NH+.
We estimated the proton affinities of HC7N, NC6N, and C7O because there are no experimental values available in the literature. We used the energy balance, at the CCSD/cc-pVTZ level of theory, between HC7N + H+ and HC7NH+, considering HC7N and H+ as independent species. We found a proton affinity value for HC7N of 798 kJ mol−1. Using analogue schemes, we obtained proton affinity values for NC6N and C7O of 755 and 1059 kJ mol−1, respectively. The proton affinity for C7O species is the highest, which makes it very favorable the formation of HC7O+. However, as discussed previously, its detection seems unlikely given that C7O has not been detected in TMC-1 and there is a stringent upper limit to its column density. The proton affinity of 798 kJ mol−1 calculated for HC7N is slightly larger than the experimental value measured for HC5N, 770 ± 20 kJ mol−1 (Edwards et al. 2009). This is in line with the trend of increasing proton affinity with increasing chain length found for cyanopolyynes.
4.2. Chemical model
The detection of HC7NH+ in TMC-1 contributes to the previous identifications of protonated cyanopolyynes of a smaller size, namely, HC5NH+ and HC3NH+, in this cloud. This allows us to have a view of the behavior of protonated species for this family of molecules. The neutral-to-protonated ratios derived in TMC-1 are HC3N/HC3NH+ = 230, HC5N/HC5NH+ = 240, and HC7N/HC7NH+ = 380. Therefore, the ratios are of the same order for the three carbon chains. Observations and chemical models suggest that the neutral-to-protonated ratio decreases with increasing proton affinity towards the neutral (Agúndez et al. 2015). The proton affinities of cyanopolyynes increase with increasing chain length. The values are 751.2, 770, and 798 kJ mol−1 for HC3N, HC5N, and HC7N, respectively, which represents only a moderate enhancement and may not translate to drastic variations in the neutral-to-protonated ratio. In fact, HC7N has the higher proton affinity and the largest neutral-to-protonated ratio, which does not fit into the trend between neutral-to-protonated ratio and proton affinity mentioned above.
To understand the chemistry of protonated cyanopolyynes, we ran a pseudo-time-dependent gas-phase chemical model of a cold dark cloud using a chemical network largely based on the RATE12 network from the UMIST database (McElroy et al. 2013). The model is similar to those presented by Agúndez et al. (2015) and Marcelino et al. (2020). The only modification with respect to those models is that here we have revised the rate coefficient of dissociative recombination of HC7NH+ and longer protonated cyanopolyynes with electrons. The value in the UMIST RATE12 network is a guess coming from Herbst & Leung (1989), but in light of the more recent experiment involving DC3ND+ (Geppert et al. 2004) and the critical evaluation of the rate coefficient of HC5NH+ + e− in the KIDA database4 (Wakelam et al. 2015), we assumed the rate coefficient and branching ratios of the dissociative recombination of HC5NH+ to also apply to longer protonated cyanopolyynes.
According to the chemical model, the peak abundances were reached at a time of ∼2 × 10⁵ yr, which is thought to be the chemical age of TMC-1 (Agúndez & Wakelam 2013). The abundances calculated at this time show a trend of decreasing abundance with increasing chain length (see dashed curves in the bottom panel of Fig. 2) that is also observed for cyanopolyynes in TMC-1 (Cernicharo et al. 1987; Agúndez et al. 2008). The protonated forms of cyanopolyynes are also predicted to be less abundant as the size of the chain increases (solid curves in the bottom panel of Fig. 2). When focusing on the abundances relative to H2, the agreement between the peak calculated abundance and the value derived from observations is reasonably good, within one order of magnitude.
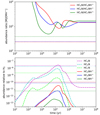 |
Fig. 2. Calculated abundances (bottom) and abundance ratios (top) as a function of time for cyanopolyynes and their protonated forms. The horizontal dotted lines correspond to values derived from observations of TMC-1. |
While the abundances relative to H2 experience great variations over time, the neutral-to-protonated ratios calculated for HC3N, HC5N, and HC7N remain nearly constant for any time longer than a few 105 yr and they stick to the same value for the three species, namely, around 103 (see top panel in Fig. 2). We see that calculated neutral-to-protonated abundance ratios are significantly lower than what has been observed for HC3N, HC5N, and HC7N. That is to say that the chemical model underestimates the abundance of the protonated form with respect to the neutral, which is something that occurs also for most protonated molecules (Agúndez et al. 2015; Cernicharo et al. 2020a). As previously discussed by Marcelino et al. (2020), the rate coefficients of the most important reactions that control the abundance of protonated molecules, namely, proton transfer to the neutral and dissociative recombination with electrons, are relatively well constrained from experiments based on HC3NH+ (Anicich 2003; Geppert et al. 2004), although they are not known for longer protonated cyanopolyynes. We suspect that uncertainties in the low-temperature rate coefficients of these reactions or missing reactions in the formation of the cation could be at the origin of the discrepancies between the calculated and observed neutral-to-protonated ratios for cyanopolyynes. In any case, the order of magnitude of the neutral-to-protonated ratios is roughly reproduced by the chemical model. The prediction is that protonated HC9N should be present with a neutral-to-protonated abundance ratio that is similar to what has been found for the smaller cyanopolyyne analogues (see Fig. 3).
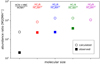 |
Fig. 3. Abundance ratios between neutral and protonated forms for the family of cyanopolyynes. Calculated values are obtained from the chemical model at a time of 2 × 10⁵ yr, while observed values are those derived in TMC-1. |
5. Conclusions
Here, we present the first detection in space of a new molecular ion, HC7NH+, toward the dark cloud TMC-1. Using the Yebes 40 m radio telescope, we observed a total of nine rotational transitions in the 31.0−50.4 GHz range. From ab initio calculations and the expected intensities of the lines for all the plausible molecular candidates, these transitions were assigned to HC7NH+. We derived a column density of (5.5 ± 0.7) × 1010 cm−2 and a HC7NH+/HC7N abundance ratio ∼380. The ratio is similar to those found for the smaller analogue systems HC3NH+/HC3N and HC5NH+/HC5N, suggesting that a similar chemistry regulates their abundances. A state-of-the-art chemical model underestimates the HC7NH+/HC7N abundance ratio observed in TMC-1, which is something that also occurs for other protonated molecules.
Q-band Ultrasensitive Inspection Journey to the Obscure TMC-1 Environment.
Acknowledgments
We thank ERC for funding through grant ERC-2013-Syg-610256-NANOCOSMOS. The Spanish authors thank Ministerio de Ciencia e Innovación for funding support through projects PID2019-106235GB-I00 and PID2019-107115GB-C21/AEI/10.13039/501100011033. M.A. thanks Ministerio de Ciencia e Innovación for grant RyC-2014-16277.
References
- Agúndez, M., & Wakelam, V. 2013, Chem. Rev., 113, 8710 [Google Scholar]
- Agúndez, M., Fonfría, J. P., Cernicharo, J., et al. 2008, A&A, 479, 493 [NASA ADS] [CrossRef] [EDP Sciences] [Google Scholar]
- Agúndez, M., Cernicharo, J., de Vicente, P., et al. 2015, A&A, 579, L10 [Google Scholar]
- Anicich, V. G. 2003, An Index of the Literature for Bimolecular Gas Phase Cation-Molecule Reaction Kinetics (Pasadena, CA: JPL Publication) [Google Scholar]
- Apponi, A. J., McCarthy, M. C., Gottlieb, C. A., & Thaddeus, P. 2000, ApJ, 530, 357 [NASA ADS] [CrossRef] [Google Scholar]
- Bizzocchi, L., & Degli Esposti, C. D. 2004, ApJ, 614, 518 [NASA ADS] [CrossRef] [Google Scholar]
- Botschwina, P., Horn, M., Markey, K., & Oswald, R. 1997, Mol. Phys., 92, 381 [NASA ADS] [CrossRef] [Google Scholar]
- Burkhardt, A. M., Lee, K. L. K., Changala, P. B., et al. 2021, ApJ, 913, L18 [Google Scholar]
- Cabezas, C., Agúndez, M., Marcelino, N., et al. 2021a, A&A, 654, A45 [NASA ADS] [CrossRef] [EDP Sciences] [Google Scholar]
- Cabezas, C., Roueff, E., Tercero, B., et al. 2021b, A&A, 650, L15 [NASA ADS] [CrossRef] [EDP Sciences] [Google Scholar]
- Cabezas, C., Agúndez, M., Marcelino, N., et al. 2022a, A&A, 657, L4 [NASA ADS] [CrossRef] [EDP Sciences] [Google Scholar]
- Cabezas, C., Fuentetaja, R., Roueff, E., et al. 2022b, A&A, 657, L5 [NASA ADS] [CrossRef] [EDP Sciences] [Google Scholar]
- Cernicharo, J. 1985, Internal IRAM Report (Granada: IRAM) [Google Scholar]
- Cernicharo, J., Guélin, M., Menten, K. M., & Walmsley, C. M. 1987, A&A, 181, L1 [NASA ADS] [Google Scholar]
- Cernicharo, J., Cabezas, C., Pardo, J. R., et al. 2019, A&A, 630, L2 [NASA ADS] [CrossRef] [EDP Sciences] [Google Scholar]
- Cernicharo, J., Marcelino, N., Agúndez, M., et al. 2020a, A&A, 642, L17 [NASA ADS] [CrossRef] [EDP Sciences] [Google Scholar]
- Cernicharo, J., Marcelino, N., Agúndez, M., et al. 2020b, A&A, 642, L8 [NASA ADS] [CrossRef] [EDP Sciences] [Google Scholar]
- Cernicharo, J., Cabezas, C., Agúndez, M., et al. 2021a, A&A, 647, L3 [EDP Sciences] [Google Scholar]
- Cernicharo, J., Agúndez, M., Kaiser, R., et al. 2021b, A&A, 652, L9 [NASA ADS] [CrossRef] [EDP Sciences] [Google Scholar]
- Cernicharo, J., Agúndez, M., Cabezas, C., et al. 2021c, A&A, 649, L15 [EDP Sciences] [Google Scholar]
- Cernicharo, J., Cabezas, C., Endo, Y., et al. 2021d, A&A, 646, L3 [EDP Sciences] [Google Scholar]
- Cernicharo, J., Cabezas, C., Bailleux, S., et al. 2021e, A&A, 646, L7 [NASA ADS] [CrossRef] [EDP Sciences] [Google Scholar]
- Cernicharo, J., Agúndez, M., Cabezas, C., et al. 2021f, A&A, 656, L21 [NASA ADS] [CrossRef] [EDP Sciences] [Google Scholar]
- Edwards, S. J., Freeman, C. G., & McEwan, J. 2009, Int. J. Mass Spectrom., 279, 82 [NASA ADS] [CrossRef] [Google Scholar]
- Fossé, D., Cernicharo, J., Gerin, M., & Cox, P. 2001, ApJ, 552, 168 [Google Scholar]
- Frisch, M. J., Trucks, G. W., Schlegel, H. B., et al. 2013, Gaussian 09, Revision D.01 (Wallingford: Gaussian, Inc.) [Google Scholar]
- Geppert, W. D., Ehlerding, A., Hellberg, F., et al. 2004, ApJ, 613, 1302 [NASA ADS] [CrossRef] [Google Scholar]
- Herbst, E., & Leung, C. M. 1989, ApJS, 69, 271 [Google Scholar]
- Hill, J. G., Mazumder, S., & Peterson, K. A. 2010, J. Chem. Phys., 132, 054108 [Google Scholar]
- Hunter, E. P. L., & Lias, S. G. 1998, J. Phys. Chem. Ref. Data, 27, 413 [Google Scholar]
- Irvine, W. M., Good, J. C., & Schloerb, F. P. 1983, A&A, 127, L10 [NASA ADS] [Google Scholar]
- Kawaguchi, K., Kasai, Y., & Ishikawa, S., et al. 1994, ApJ, 420, L95 [NASA ADS] [CrossRef] [Google Scholar]
- Knizia, G., Adler, T. B., & Werner, H.-J. 2009, J. Chem. Phys., 130, 054104 [Google Scholar]
- Marcelino, N., Agúndez, M., Tercero, B., et al. 2020, A&A, 643, L6 [NASA ADS] [CrossRef] [EDP Sciences] [Google Scholar]
- McCarthy, M. C., Zou, L., & Martin-Drumel, M.-A. 2017, J. Chem. Phys., 146, 154301 [Google Scholar]
- McElroy, D., Walsh, C., Markwick, A. J., et al. 2013, A&A, 550, A36 [NASA ADS] [CrossRef] [EDP Sciences] [Google Scholar]
- McGuire, B. A., Burkhardt, A. M., Kalenskii, S., et al. 2018, Science, 359, 202 [Google Scholar]
- McGuire, B. A., Loomis, R. A., Burkhardt, A. M., et al. 2021, Science, 371, 1265 [Google Scholar]
- Møller, C., & Plesset, M. S. 1934, Phys. Rev., 46, 618 [Google Scholar]
- Ogata, T., Ohshima, Y., & Endo, Y. 1995, J. Am. Chem. Soc., 117, 12 [Google Scholar]
- Pardo, J. R., Cernicharo, J., & Serabyn, E. 2001, IEEE Trans. Antennas Propag., 49, 12 [Google Scholar]
- Pardo, J. R., Cabezas, C., Fonfría, J. P., et al. 2021, A&A, 652, L13 [NASA ADS] [CrossRef] [EDP Sciences] [Google Scholar]
- Schilke, P., Walmsley, C. M., Millar, T. J., & Henkel, C. 1991, A&A, 247, 487 [Google Scholar]
- Shingledecker, C. N., Lee, K. L. K., Wandishin, J. T., et al. 2021, A&A, 652, L12 [NASA ADS] [CrossRef] [EDP Sciences] [Google Scholar]
- Tercero, F., López-Pérez, J. A., Gallego, J. D., et al. 2021, A&A, 645, A37 [EDP Sciences] [Google Scholar]
- Turner, B. E., Terzieva, R., & Herbst, E. 1999, ApJ, 518, 699 [NASA ADS] [CrossRef] [Google Scholar]
- Wakelam, V., Loison, J.-C., Herbst, E., et al. 2015, ApJS, 217, 20 [Google Scholar]
- Werner, H. J., Knowles, P. J., Knizia, G., et al. 2020, MOLPRO, version 2020.2 [Google Scholar]
- Woon, D. E., & Dunning, T. H., Jr. 1993, J. Chem. Phys., 98, 1358 [NASA ADS] [CrossRef] [Google Scholar]
All Tables
Theoretical spectroscopic parameters for the different molecular candidates for the observed lines in TMC-1 (all in MHz).
All Figures
|
Fig. 1. Observed lines of HC7NH+ in TMC-1 in the 31.0−50.4 GHz range. Frequencies and line parameters are given in Table 1. Quantum numbers for the observed transitions are indicated in each panel. The red line shows the synthetic spectrum computed for a rotational temperature of 8.5 K and a column density of 5.5 × 1010 cm−2 (see text). Blanked channels correspond to negative features created in the folding of the frequency switching data. The label U corresponds to unidentified features above 4σ. |
| In the text | |
|
Fig. 2. Calculated abundances (bottom) and abundance ratios (top) as a function of time for cyanopolyynes and their protonated forms. The horizontal dotted lines correspond to values derived from observations of TMC-1. |
| In the text | |
|
Fig. 3. Abundance ratios between neutral and protonated forms for the family of cyanopolyynes. Calculated values are obtained from the chemical model at a time of 2 × 10⁵ yr, while observed values are those derived in TMC-1. |
| In the text | |
Current usage metrics show cumulative count of Article Views (full-text article views including HTML views, PDF and ePub downloads, according to the available data) and Abstracts Views on Vision4Press platform.
Data correspond to usage on the plateform after 2015. The current usage metrics is available 48-96 hours after online publication and is updated daily on week days.
Initial download of the metrics may take a while.