| Issue |
A&A
Volume 659, March 2022
|
|
|---|---|---|
| Article Number | A81 | |
| Number of page(s) | 16 | |
| Section | Interstellar and circumstellar matter | |
| DOI | https://doi.org/10.1051/0004-6361/202142703 | |
| Published online | 09 March 2022 | |
The sharp ALMA view of infall and outflow in the massive protocluster G31.41+0.31
1
INAF-Osservatorio Astrofisico di Arcetri,
Largo E. Fermi 5,
50125
Firenze,
Italy
e-mail: This email address is being protected from spambots. You need JavaScript enabled to view it.
2
Centro de Astrobiología (CSIC-INTA),
Ctra. de Ajalvir Km. 4,
Torrejón de Ardoz,
28850
Madrid,
Spain
3
Leiden Observatory, Leiden University,
PO Box 9513,
2300
RA Leiden,
The Netherlands
4
Max-Planck-Institut für Astronomie,
Königstuhl 17,
69117
Heidelberg,
Germany
5
Jodrell Bank Centre for Astrophysics, The University of Manchester,
Alan Turing Building,
Manchester
M13 9PL,
UK
6
Dipartimento di Fisica, Università degli Studi di Cagliari,
SP Monserrato-Sestu km 0.7,
09042
Monserrato,
Italy
7
INAF-Osservatorio Astronomico di Cagliari,
via della Scienza 5,
09047
Selargius,
Italy
8
UK Astronomy Technology Centre, Royal Observatory Edinburgh,
Blackford Hill,
Edinburgh
EH9 3HJ,
UK
9
Zentrum für Astronomie der Universität Heidelberg, Institut für Theoretische Astrophysik,
Albert-Ueberle-Straße 2,
69120
Heidelberg,
Germany
10
Instituto de Astrofísica e Ciências do Espaço, Universidade do Porto, CAUP,
Rua das Estrelas,
4150-762
Porto,
Portugal
11
Max-Planck-Institut für Astrophysik,
Karl-Schwarzschild-Str. 1,
85748
Garching,
Germany
12
I. Physikalisches Institut, Universität zu Köln,
Zülpicher Str. 77,
50937
Köln,
Germany
13
Kapteyn Astronomical Institute, University of Groningen,
9700
AV Groningen,
The Netherlands
14
SRON Netherlands Institute for Space Research,
Landleven 12,
9747
AD Groningen,
The Netherlands
15
Department of Earth and Space Sciences, Indian Institute of Space Science and Technology,
Thiruvananthapuram,
695 547,
India
Received:
19
November
2021
Accepted:
24
January
2022
Abstract
Context. To better understand the formation of high-mass stars, it is fundamental to investigate how matter accretes onto young massive stars, how it is ejected, and how all this differs from the low-mass case. The massive protocluster G31.41+0.31 is the ideal target to study all these processes because observations at millimeter and centimeter wavelengths have resolved the emission of the Main core into at least four massive dust continuum sources, named A, B, C, and D, within 1″ or 0.018 pc, and have identified signatures of infall and several outflows associated with the core.
Aims. We study the interplay between infall and outflow in G31.41+0.31, at a spatial resolution of a few 100 au, by investigating their properties and their possible impact on the core.
Methods. We carried out molecular line observations of typical high-density tracers, such as CH3CN or H2CO, and shock and outflow tracers, such as SiO, with ALMA at 1.4 mm that achieved an angular resolution of ~0.′′09 (~340 au).
Results. The observations reveal inverse P Cygni profiles in CH3CN and H2CO toward the four sources embedded in the Main core, suggesting that all of them are undergoing collapse. The infall rates estimated from the redshifted absorption are on the order of ~10−2 M⊙ yr−1. The individual infall rates imply that the accretion timescale of the Main core is an order of magnitude smaller than its rotation timescale. This confirms that rotating toroids such as the G31 Main core are non-equilibrium, transient collapsing structures that need to be constantly replenished with fresh material from a large-scale reservoir. For sources B, C, and D the infall could be accelerating inside the sources, while for source A the presence of a second emission component complicates the interpretation. The SiO observations have revealed the presence of at least six outflows in the G31.41+0.31 star-forming region, and suggest that each of the four sources embedded in the Main core drives a molecular outflow. The outflow rates are on the order of ~10−5–10−4 M⊙ yr−1, depending on the SiO abundance. The feedback of the outflows appears sufficient to sustain the turbulence in the core and to eventually disrupt the core or prevent its further collapse. The mass accretion rates onto the individual sources, estimated from the highest values of the outflow mass loss rates, are on the order of 10−4 M⊙ yr−1. The difference of about two orders of magnitude between the accretion rates and the infall rates suggests that the central stars and the jets and outflows might not be efficient in removing disk material, which could lead to gravitational instabilities, fragmentation of the disk, and episodic accretion events.
Conclusions. Infall and outflows are simultaneously present in all four sources embedded in the high-mass star-forming core G31.41+0.31. This indicates that these sources are still actively accreting and have not reached their final mass yet, which confirms the youth of this massive core.
Key words: ISM: individual objects: G31.41+0.31 / stars: formation / stars: massive / techniques: interferometric
© ESO 2022
1 Introduction
The formation of stars with masses higher than 20–30 M⊙ is among the least understood phenomena in modern astrophysics. Observations of massive outflows (e.g., Shepherd & Churchwell 1996; Arce et al. 2007) suggest a scaled-up version of low-mass star formation Krumholz (2015), but the lackof evidence for massive pre-stellar cores Motte et al. (2018) and, in particular, of protostellar disks around verymassive (early O-type) stars (Beltrán & de Wit 2016; Beltrán et al. 2020) challenges that idea.
One way to investigate the possible similarities between low-mass and high-mass star formation is to study the outflows and infall associated with young stellar objects. According to theory, the accretion and ejection of material are two phenomena closely related in the formation of stars (e.g., Shu et al. 1987), and this relationship has been observationally established for low-mass stars (e.g., Frank et al. 2014, and references therein). However, while the presence of jets and outflows is easily identifiable thanks to their large-scale emission and to their characteristic line profiles with high-velocity wings, the evidence for collapse is more difficult to reveal. This is in part because infall and accretion usually happen in the inner regions of the cores, where infall motions can be confused with rotation and outflow. The situation is particularly complicated for high-mass young stellar objects because the high visual extinction in massive star-forming cores makes their central regions usually only detectable at far-infrared and longer wavelengths. Redshifted molecular absorption against a bright background continuum source is the only unambiguous way of diagnosing infall because the absorbing material must be located in front of the protostar (e.g., Chandler et al. 2005; Wyrowski et al. 2012). Infall motions are easily distinguishable from outflow and rotation; in the former case, one should see blueshifted absorption or possibly emission, while in the latter case, since the motions are perpendicular to the line of sight, any absorption should occur only at systemic velocities.
To study infall in high-mass star-forming regions, observations of high spatial resolution and sensitivity of high-density tracers with excitation energies below the brightness temperature of the central continuum source are required. In this way, it is possible to trace the gas of the inner parts of these distant and complex star-forming regions. The advent of (sub)millimeter interferometers has revolutionized the field, as it has allowed us to study for the first time the dust close to the embedded massive protostar(s) and the kinematics of the gas at (sub)arcsecond resolution (e.g., Olmi et al. 1996; Wyrowski et al. 1999, 2002), highlighting the occurrence of infall (e.g., Ho & Haschick 1986; Keto et al. 1988). In recent years, evidence of collimated outflows and infall signatures have been identified in massive young stellar objects (e.g., Beuther et al. 2002; Arce et al. 2007; Beltrán et al. 2011), and references therein), also establishing for high-mass stars the relationship between accretion and ejection. However, the number of studies of infall and outflows in high-mass star-forming regions on scales of a few hundred au is still limited (e.g., Goddi et al. 2020), in particular if compared to those of the low-mass regime.
To characterize the motions of the deeply embedded gas that could reveal signatures of rotation and infall and that would help us to understand the formation of massive stars, for many years we have been carrying out multiple high angular resolution studies of hot molecular cores (HMCs), first with the IRAM Plateau de Bure (PdB) and Submillimeter Array (SMA) interferometers (Beltrán et al. 2004, 2005, 2011a,b), and later on with the Atacama Large Millimeter/submillimeter Array (ALMA, Cesaroni et al. 2017; Beltrán et al. 2018, 2021; Moscadelli et al. 2018, 2021; Goddi et al. 2020) and the IRAM NOrthern Extended Millimeter Array (NOEMA, Gieser et al. 2019, 2021). Cesaroni et al. (2017) carried out an extensive and systematic search for circumstellar disks around O-type stars by observing a sample of HMCs at 1.4 mm and 0.′′2 resolution with ALMA. One of the HMCs of the sample is G31.41+0.31 (hereafter G31), which is located at 3.75 kpc Immer et al. (2019), has a luminosity of ~ 5 × 10⁴ L⊙ Osorio et al. (2009), and displays a clear NE–SW velocity gradient suggestive of rotation (e.g., Beltrán et al. 2004). Among the HMCs studied, G31 stands out as the only source that displays accelerating infall and rotational spin-up (Beltrán et al. 2018). This characteristic suggests that the source is in an earlier evolutionary stage compared to all other targets in the Cesaroni et al. sample. At an angular resolution of 0.′′2 (~ 750 au), the dust continuum emission traces a well-resolved, monolithic, and featureless core, called Main by Beltrán et al. (2018), with no hint of fragmentation despite the high mass (~ 70 M⊙; Cesaroni et al. 2019) and the diameter of ~8000 au. However, new ALMA observations at 1.4 and 3.5 mm at a higher angular resolution of ~ 0.′′1 (~ 375 au), and Very Large Array (VLA) observations at 7 mm and ~ 0.′′05 (~ 190 au) resolution have resolved for the first time the HMC into a small protocluster composed of at least four massive sources, named A, B, C, and D and with masses ranging from ~15 to ~ 26 M⊙, within the central 1″ (~ 3750 au) region of the core (Beltrán et al. 2021). These observations have revealed that the homogeneous appearance previously observed at 1.4 mm and 0.′′2 is a consequence of both high dust opacity and insufficient angular resolution. Besides the four sources embedded in the Main core, there are six additional millimeter sources located very close to the core which appear to outline streams or filaments of matter pointing to the HMC (Beltrán et al. 2021).
The four dust continuum sources embedded in the Main core have also been detected at centimeter wavelengths (Cesaroni et al. 2010; Beltrán et al. 2021). The analysis of their spectral energy distribution suggests that the centimeter emission of sources A, B, and D probably originates from thermal radio jets. This would indicate the presence of different molecular outflows associated with the sources embedded in the core and, in fact, CO and SiO observationshave revealed the presence of several outflows in G31 (Olmi et al. 1996; Cesaroni et al. 2011; Beltrán et al. 2018).
The massive collapsing protocluster G31 is the ideal target to investigate the properties of infall and outflow and their relationship in the high-mass star-forming regions at scales of a few 100s of au. In this study we analyze molecular line observations carried out at 1.4 mm and ~ 0.′′09 resolution (~340 au) with ALMA to trace the kinematics in the central region of this high-mass star-forming core. The spectral setup of the interferometer includes typical high-density tracers, such as CH3CN and its isotopologs and H2CO, and the shock and outflow tracer SiO. The aim of the observations is to investigate the infall toward the individual sources embedded in the Main core and measure the corresponding mass infall rates from the infall velocity and the gas column density, as well as tostudy the properties of the molecular outflows detected in the region and their possible impact on the star formation in the G31 core.
This article is organized as follows: in Sect. 2 we describe the observations; in Sect.3 we present the results, the emission of dense core and molecular outflow tracers; in Sect. 4 we analyze the properties of the molecular outflows; in Sect. 5 we discuss the infall toward the embedded sources. Finally, in Sect. 5 we give our main conclusions.
2 Observations
Interferometric observations of G31 at 1.4 mm in Band 6 were carried out with ALMA in Cycle 4 as part of project 2016.1.00223.S (PI: M. Beltrán). The observations were carried out in one of the most extended configurations, C40-7, and were combined with those of the ALMA Cycle 2 project 2013.1.00489.S (PI: R. Cesaroni), which were observed in the extended C34-7/(6) configuration and with the same digital correlator configuration: 13 spectral windows (SPWs) that cover, among other lines, SiO (5–4), H2CO (30,3–20,2), (32,2 –22,1), and (32,1 –22,0), CH3CN (12K–11K), CH CN (12K–11K), CH3CN v8 = 1 (12K–11K), and 13CH3CN (13K–12K). The SPW0 window that covers SiO and three transitions of H2CO has a bandwidth of 1875 MHz and a spectral resolution of 1.95 MHz, which corresponds to a velocity resolution of ~ 2.7 km s−1, and was used to determine the continuum emission. The spectral resolution of CH3CN and CH
 CN is 0.244 MHz, which translates into a velocity resolution of ~ 0.33 km s−1, and that of CH3CN v8 and 13CH3CN is 0.488 MHz, which corresponds to ~ 0.66 km s−1. We refer to Cesaroni et al. (2017), Beltrán et al. (2018), and Beltrán et al. (2021) for detailed information on the observations.
The phase reference center of the observations was set to the position α(J2000) = 18h47m34. s315, δ(J2000) = −01°12′45.′′9. The data were calibrated and imaged using the CASA1 software package. We assumed the standard uncertainty on the ALMA absolute flux calibration of ~ 10% in Band 6. Maps were created with the ROBUST parameter of Briggs (1995) set equal to 0. Further imaging and analysis were done with the GILDAS2 software package. The continuum was subtracted from the line emission using the STATCONT3 algorithm (Sánchez-Monge et al. 2018). The resulting synthesized CLEANed beam of the maps is 0.′′11 × 0.′′08, which corresponds to spatial scales of ~350 au at the distance of G31, and position angle, PA, − 83° for SiO (5–4) and H2CO (30,3 –20,2), (32,2 –22,1), and (32,1 –22,0); − 57° for CH3CN (12–11) K = 0 to 7 and CH CN (12–11) K = 0 to 4; + 73° for CH3CN (12–11) K ≥ 8 and CH
 CN (12–11) K ≥ 5; − 79° for 13CH3CN (13–12); and − 32° for CH3CN v8 = 1 (12–11). The rms noise of the maps is 0.45 mJy beam−1 for SiO and H2CO, and 0.8–0.9 mJy beam−1 for CH3CN, CH
 CN, CH3CN v8 = 1, and 13CH3CN.
3 Results and analysis
The configuration of the digital correlator of ALMA allows us to observe a wide range of frequencies simultaneously and, for sources as chemically rich as G31, to observe the emission of species tracing different physical conditions (temperature and density) and phenomena. In this work, we focus on CH3CN (ground state and vibrationally excited), SiO, and H2CO to trace infall and outflow in the region.
3.1 Infall emission
Beltrán et al. (2018) analyzed 1.4 mm ALMA observations toward the Main core of the HMC G31 carried out at an angular resolution of ~ 0.′′2 (~ 750 au). These observations reveal that the high-density tracers, such as CH3CN and CH3OCHO, trace a ring-like structure, while the dust continuum traces a homogeneous and almost spherical core whose emission peaks at the central dip of the line emission. This morphology is observed for transitions with very different excitation conditions and upper level energies, which range from ~70 K to 850 K. The spectra of these transitions toward the dust continuum emission peak clearly show inverse P Cygni profiles, with strong redshifted absorption even for transitions with high upper level excitation energies, Eup∕kB, such as CH3CN K = 8 (Eup∕kB = 526 K) and CH3CN v8 = 1 K, l = (6, 1) (Eup∕kB = 778 K).
Here the new ALMA observations at a higher angular resolution of ~ 0.′′09 (~ 340 au) confirm the presence of absorption toward the center of the Main core of G31 and show that this absorption is indeed detected toward all four sources, A, B, C, and D, embedded in it. This is clearly seen for sources A and B in Fig. 1, where the 1.4 mm dust continuum emission is overlaid on the integrated intensity map of the CH3CN K = 4 transition, and for all sources in Fig. 2, which shows the moment maps for CH CN K = 3, CH3CN K = 8, and CH3CN v8 = 1 K, l = (6, 1). As seen in these figures, the integrated line emission clearly decreases toward the position of the four continuum sources, and for sources A and B the moment 0 maps show absorption. In CH
 CN K = 3 (Fig. 2), the absorption toward the center of the Main core outlines the 50% contour level of the dust continuum emission at 1.4 mm.
3.1.1 Moment maps
As already mentioned, the moment 0 maps of CH3CN and isotopologs (Fig. 2) clearly indicate the presence of absorption toward the center of the G31 Main core. In addition to this central absorption, the integrated intensity maps also show an increase in emission to the southeast of sources A and B, which becomes spatially smaller and approaches the sources as the upper level energy of the transition (Eup∕kB) increases. The enhancement of methyl cyanide emission coincides with the direction of an SiO molecular outflow powered by source B (see Sect. 3.2.1), and this suggests that the gas-phase abundance of CH3CN might have been locally enhanced in protostellar shocks (e.g., Arce et al. 2008; Codella et al. 2009; Palau et al. 2017).
The line velocity maps trace the NE–SW velocity gradient seen in different species and interpreted as rotation of the core by different studies (e.g., Beltrán et al. 2004, 2005, 2018; Girart et al. 2009; Cesaroni et al. 2011). This velocity gradient is less evident in CH CN K = 3, but this could be a result of the interaction of the core with the multiple outflows in the area (see Sect. 3.2.1). The velocity dispersion maps show an increase toward the central position, in particular to the southeast of source B and to west and southwest of source A, in correspondence with the SiO molecular outflows associated with these sources, as discussed in Sect. 3.2.1. The enhancement associated with the outflow powered by source A is more evident in the moment 2 map of CH
 CN K = 3.
The spectra of the different K-components of CH3CN (Figs. 3 and 4) and, especially, of the different transitions of H2CO (Fig. 5), integrated over the beam toward the position of the dust continuum emission peak of each source, confirm that the absorption is clearly redshifted for all sources. The systemic velocity of the Main core estimated from methyl cyanide is 96.5 ± 0.5 km s−1 (e.g., Beltrán et al. 2018). If the redshifted absorption is interpreted as infall, this suggests that the material is still collapsing toward the sources, and therefore that the young stellar objects have not reached their final mass yet. The deepest absorption of ~ − 150 K is observed in H2CO (30,3–20,2) toward sources A and B, while the absorption is ~ − 90 K for source C and ~ − 40 K for source D. The peak brightness temperature of the dust continuum emission at 1.4 mm estimated by Beltrán et al. (2021) is 150 ± 15 K (source A), 156 ± 16 K (source B), 102 ± 10 K (source C), and 48 ± 5 K (source D). Therefore, this indicates that the absorbed fraction, which is between 80 and 100%, is very high for all sources.
The redshifted absorption is also clearly seen in CH3CN toward sources A, B, and C (Figs. 3 and 4), but it is less evident toward source D when averaged over the beam. However, when searching pixel by pixel and channel by channel around the position of the dust continuum emission peak of source D, the line appears in absorption at different velocities. The deepest absorption in CH3CN is observed for sources A and B, and reaches ~ − 90 K for CH3CN K = 0, while the absorption is ~ − 45 K for source C. The absorbed fraction in this case would be ~60% for sources A and B, and ~50% for source C. Figure 3 shows that the deepest redshifted absorption occurs at different frequencies (or velocities) for the different sources, especially for sources A and B. This discrepancy in the velocity of the absorption is not visible in H2CO (Fig. 5) because the spectral resolution of the observations, ~ 2.7 km s−1, is not high enough. In Fig. 4, we plot the spectra of the CH3CN K = 3 transition only, with the x-axis in units of velocity, to better show the velocity of the redshifted absorption. The velocity of the absorption for source A is ~ 100.5 ± 0.3 km s−1, while the velocity for sources B and C is almost 2 km s−1 higher, 102.2 ± 0.3 and 102.5 ± 0.3 km s−1, respectively. For source D, we estimated the velocity of the deepest absorption pixel by pixel and found that for the K = 3 transition the value is 104.8 ± 0.3 km s−1. These velocities are between ~4 and ~ 8 km s−1 higher than the systemic velocity of the Main core, which is 96.5 ± 0.5 km s−1 (e.g., Beltrán et al. 2018).
The spectra of CH3CN for source B shows a clear inverse P Cygni profile for all the K-components (Figs. 3 and 4). On the other hand, the spectra of source A and, although less evident, of source C show a much broader absorption profile with a tail extending to redshifted velocities for source A and blueshifted velocities for source C. In addition, the spectra of source A show a secondary absorption dip at blueshifted velocities, at ~ −3 km s−1 from the systemic velocity (see Figs. 3 and 4). The shape of these profiles suggests the presence of different components that could either be related to the gas surrounding each source or indicate the presence of unresolved sources associated with cores A and C. The latter hypothesis would suggest that fragmentation has happened on scales smaller than the spatial resolution of our observations (~ 340 au). Beltrán et al. (2021) have carried out 7 mm observations at ~ 2 times higher angular resolution (~ 0.′′05 or ~190 au) with the VLA, but have not found evidence of secondary companions for sources A and B, at least at scales of a few hundred au. Therefore, this suggests that the presence of different components is related to the gas emission itself.
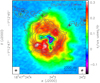 |
Fig. 1 Overlay of the ALMA 1.4 mm continuum emission (white contours) of G31.41+0.31 on the integrated intensity (moment 0) map (colors) of CH3CN K = 4 (Eup ∕kB = 183 K). The line emission has been integrated over the velocity range 92–102 km s−1. The contours are 3, 6, 9, 15, 30, 60, 90, 120, and 165 times 1 σ, which is 0.32 mJy beam−1. The red crosses indicate the positions of the sources detected in the region by Beltrán et al. (2021). The synthesized beam of the 1.4 mm continuum emission (0.′′11 × 0.′′08, PA = − 83°) and CH3CN K = 4 (0.′′11 × 0.′′08, PA = − 57°) are shown in the lower left and right corner, respectively. |
3.1.2 Infall in individual sources
From the redshifted absorption it is possible to estimate the infall rate, Ṁinf, if the density and the size of the core are known, and assuming that the infall velocity, Vinf, is equal to the difference between the velocity of the absorption feature and the systemic local standard of rest (LSR) velocity. Assuming that the material is free falling, and therefore that Vinf is proportional to R−1∕2, the infall rate inside a solid angle Ω can be estimated from this expression (see Appendix A for the detailed derivation of the mass infall rate):
 (1)
(1)
Here, Rc is the radius of the core, Vinf(Rc) the infall velocity at Rc, mH the mass of the H atom, μ = 2.8 the mean molecular weight, and  the mean number density in the core. Both Rc and
  have been estimated from dust continuum observations at 3.5 mm and ~ 0.′′075 resolution by Beltrán et al. (2021). Although Vinf can be easily obtained from the spectra, the radius at which this infall velocity is associated is not known. Given that the upper level energies of the observed transitions of H2CO are lower than those of CH3CN, we assume that the former species is tracing cooler material located closer to the surface of the core than the latter. Therefore, to estimate Ṁinf, we assume that Vinf(Rc) is similar to the infall velocity estimated from H2CO. Because the velocity of the absorption is different depending on the H2CO transition, as seen in Fig. 5, to estimate Vinf(Rc), and therefore Ṁinf, we use the mean of the infall velocity obtained from each of the H2CO transitions.
Table 1 shows the Ṁinf estimated for each source embedded in the Main core together with Vinf estimated from H2CO. The infall rates were estimated assuming Ω = 4 π; infall is observed in all the sources, which suggests that it cannot be very radially asymmetric, otherwise it would be statistically unlikely to observe collapse in all of them, unless they are aligned. We note that these infall rates should be considered upper limits because Ω could be smaller than 4 π and the infall velocity at Rc could be even smaller than that obtained from H2CO. Table 1 also shows, for comparison, the infall velocities obtained from CH3CN K = 3. As expected, because CH3CN is probably tracing the embedded dense gas deeper than H2CO, these infall velocities are greater. We note that the infall rates estimated using the infall velocities obtained from CH3CN K = 3 would be a factor of ~2–4 higher than those estimated with H2CO.
As seen in this table, the infall rates are high and similar for all the sources and are similar to the infall rate of 0.028 M⊙ yr−1 estimated for the whole Main core by Beltrán et al. (2021), assuming a mean density of ~ 4 × 107 cm−3 and a radiusof ~4000 au. Redshifted H2 18O (111–000) absorption observed with Herschel by van der Tak et al. (2019) indicates a similar infall rate of ~ 10−2 M⊙ yr−1 in G31.
Infall rates on the order of ~ 10−2 M⊙ yr−1 for all four sources imply that the mass of the Main core, ~ 70 M⊙ Cesaroni et al. (2019), would be incorporated in the sources in ~ 1000 yr. This accretion timescale of the Main core is similar to the free-fall times of the individual sources A to D, which are ~ 700–900 yr. This suggests that the sources are not dynamically individual objects, but evolve together with the Main core in which they are embedded; in other words, the stars inside are not forming from the individual mass reservoirs of sources A to D, but have the entire mass reservoir of the Main source available to build up more massive stars. The accretion timescale of the Main core is an order of magnitude smaller than its rotation timescale, which is ~ 4 × 10⁴ yr assuming a rotation velocity of ~ 3 km s−1 (estimated as half the range of the velocity gradient) and a radius of ~ 4000 au (see Fig. 2). This confirms that rotating toroids, like the HMC G31 core (Beltrán et al. 2005), are non-equilibrium, transient collapsing structures that must be constantly replenished with fresh material from a large-scale material reservoir (e.g., Kuiper & Hosokawa 2018). For G31 this reservoir of material has recently been identified by means of N2H+ observations of the parsec-scale IR-dark clump surrounding the HMC (Beltrán et al., in prep.).
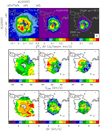 |
Fig. 2 Moment maps of CH3CN and isotopologs. Top panels: Overlay of the ALMA 1.4 mm continuum emission (contours) on the integrated intensity (moment 0) map (colors) of CH |

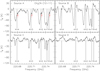 |
Fig. 3 CH3CN (12–11) spectra of the K = 0, 1, 2, 3, and 4 transitions averaged over a beam toward the position of the dust continuum emission peak of the four sources embedded in the Main core of G31. The black lines indicate the different K components shifted to the frequency of the ambient gas velocity (96.5 km s−1). The red arrows in the top left panel indicate the secondary absorption component at blueshifted velocities associated with source A. |
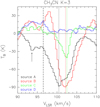 |
Fig. 4 Same as Fig. 3, but for the CH3CN (12–11) K = 3 transition. The x-axis is in units of velocity. The vertical dashed line indicates the systemic LSR velocity of 96.5 ± 0.5 km s−1 (Beltrán et al. 2018). The black, red, and green dotted vertical lines indicate the velocity of the deepest absorption toward sources A, B, and C, respectively. The black arrow indicates the secondary absorption component at blueshifted velocities associated with source A. |
Infall parameters.
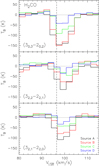 |
Fig. 5 Same as Fig. 3, but for H2CO (30,3 –20,2) (Eup ∕kB = 21 K), (32,2 –22,1) (Eup ∕kB = 68 K), and (32,1–22,0) (Eup ∕kB = 68 K). The x-axis is in units of velocity. The vertical dashed line indicates the systemic LSR velocity of 96.5 ± 0.5 km s−1 (Beltrán et al. 2018). |
3.2 Outflow emission
Observations of CO, 13CO, and SiO have revealed the presence of several molecular outflows in G31 (Olmi et al. 1996;Cesaroni et al. 2011; Beltrán et al. 2018). The SiO emission observed at ~ 0.′′2 (~ 750 au) resolution by Beltrán et al. (2018) has revealed the presence of at least three molecular outflows in the region: a strong east–west (E–W) outflow, and two weaker north–south (N–S) and northeast–southwest (NE–SW) outflows.
The new SiO (5–4) ALMA observations at ~ 0.′′09 (~ 340 au) reveal the presence of additional molecular outflows in the G31 HMC as shown in Fig. 6. In each box of this figure we show the SiO channel maps corresponding to the blueshifted and redshifted emission at about the same velocity offset (in absolute value) from the systemic velocity (96.5 ± 0.5 km s−1). The blueshifted and redshifted emission observed at high velocities (from ~ 60 to 69 km s−1 for the blueshifted emission and from 125 to 139 km s−1 for the redshifted emission) toward the HMC is probably contaminated by emission of a high-density tracer. Possible contaminants are ethylene glycol, (CH2OH)2, at blueshifted velocities and cyanide radical, 13CN, at redshifted velocities. Both species have been detected in G31 (Rivilla et al. 2017; C. Mininni, priv. comm.).
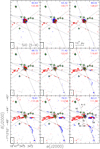 |
Fig. 6 Velocity channel maps of the SiO (5–4) line emission (colors) overlaid on the 1.4 mm continuum emission (grayscale). Each box contains pairs of maps corresponding to the blue- (blue contours) and redshifted (red contours) emission at about the same velocity offset (in absolute value) from the systemic velocity (96.5 ± 0.5 km s−1). The corresponding LSR velocities are indicated at the top right of the box. The conversion factor from Jy beam−1 to K, in the Rayleigh-Jeans approximation, is 2844. Contour levels are 3, 6, 9, 12, 15, and 20 times 0.55 mJy beam−1. Grayscale levels are 3, 20, 83, and 165 times 1 σ times 0.32 mJy beam−1. The synthesized beam of 0.′′11 × 0.′′08, PA = − 83°, is shown in the lower left corner of each panel. The black dotted lines indicate the direction of the six outflows identified in G31 in this work. The labels of the outflows are indicated in the bottom right panel. The yellow crosses indicate the positions of the four continuum sources embedded in the Main core and the green crosses give the positions of the rest of the continuum sources detected in the region (Beltrán et al. 2021). |
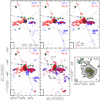 |
Fig. 6 Continued. Colored contour levels are 3, 6, 9, 12, 15, 20, and 30 times 0.7 mJy beam−1. The bottom right panel is a close-up of the central region to better show the 1.4 mm continuum emission and the position of sources A, B, C, D, and NE. Grayscale and contour levels are 3, 6, 24, 48, 96, and 165 times 1 σ times 0.32 mJy beam−1. |
3.2.1 Individual outflows
The SiO emission suggests the presence of at least six outflows in the G31 star-forming region, which are highlighted in Fig. 7, where we have plotted the emission averaged over different velocity intervals. We describe below each of the outflows and discuss their possible driving sources. We note that because of the complexity of the region, with several sources and outflows within few 1000s au, the attribution of a certain driving source to a given outflow is further complicated by possible changes in the outflow direction.
E–W outflow
The E–W outflow, which is the strongest in the region, is clearly detected at all velocity intervals (at least the redshifted emission). We note that, as suggested by Beltrán et al. (2018), the eastern redshifted lobe could be contaminated by emission from the NE–SW outflow, especially at low velocities. Source D could be driving this outflow, as suggested by Beltrán et al. (2021), because it is located at about the center of symmetry of the eastern and western lobes.
SW outflow
The velocity channel maps (Fig. 6) suggest that part of the SiO emission of the western lobe of the E–W outflow could be powered by source A. The presence of SiO emission that appears to be driven by source A starts to be visible for velocities higher than ~ 90 km s−1 and is more evident for channels with velocities closer to the systemic LSR velocity of ~ 96.5 km s−1, as seen in Fig. 8, where we plot the SiO emission averaged over the (93, 104) km s−1 velocity interval overlaid on the dust continuum emission at 1.4 mm. The SiO emission westward of the HMC shows two molecular lobes that end in bow shocks, with the shorter lobe clearly pointing to the position of source A. The longer lobe, which shows a clear bow shock shape, could be associated with the E–W outflow or, alternatively, with source A. From the observations, it is not possible to distinguish between these two possibilities. Toward the position of the dust continuum sources, SiO is seen in absorption, making it difficult to clearly associate the outflow emission with its corresponding powering source. In summary, the SiO observations suggest the presence of two overlapping outflows to the southwest of the Main core: the E–W outflow, driven by source D, with redshifted emission mainly eastward of source D and blueshifted emission, with velocities between ~ 71 and ~ 90 km s−1, to the west; and the SW outflow, driven by source A, with a clear southwestern lobe of overlapping blueshifted and redshifted emission. We note that the redshifted emission is possibly contaminated by some redshifted emission from the E–W outflow.
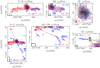 |
Fig. 7 Overlay of the ALMA 1.4 mm continuum emission (grayscale) on the blueshifted (blue contours) and redshifted (red contours) SiO (5–4) emission averaged over different velocity intervals for the six outflows detected in the region. The velocity ranges within which the blueshifted and redshifted emission were averaged is indicated in square brackets in each panel. The systemic LSR velocity of G31 is 96.5 km s−1. Contour levels are 3, 6, 12, and 24 times 0.35 mJy beam−1 (blue and red) for the E–W and NE–SW outflows; 0.6 mJy beam−1 (blue) and 0.4 mJy beam−1 (red) for the SW outflow; 1.0 mJy beam−1 (blue) and 1.5 mJy beam−1 (red) for the SE outflow; 0.36 mJy beam−1 (blue) and 0.4 mJy beam−1 (red) for the N–S outflow; and 0.22 mJy beam−1 (blue) and 0.32 mJy beam−1 (red) for the NE outflow. The conversion factor from Jy beam−1 to K is 2844. Grayscale contours for the continuum emission are 0.96, 3.2, 6.4, 14.4, 28.8, and 54.4 mJy beam−1. The black dotted line indicates the direction of the outflow and the green cross the position of the suggested driving source. |
SE outflow
Figure 8 points to the presence of an outflow associated with source B. As seen in this figure and also in the channel maps of Fig. 6, the strongest SiO emission seems to delineate a collimated molecular outflow from source B, which we name outflow SE. This outflow is better traced at low blueshifted and redshifted velocities with respect to the systemic velocity, in particular for the velocity interval (90, 103.8) km s−1.
N–S outflow
The direction of the N–S outflow is mainly traced by the southernmost and northernmost knots, which are visible from low to intermediate velocities. The southernmost knot shows a clear bow-shock shape at velocities closer to the systemic velocities (Fig. 6). Regarding its powering source, Beltrán et al. (2018) suggested that it could be one of the two free-free sources detected by Cesaroni et al. (2010), which Beltrán et al. (2021) identified as sources A and B. As seen in Figs. 6 and 7, the line connecting the redshifted and blueshifted knots crosses the position of source D and passes slightly west of source C. Taking into account the poor accuracy of the direction of the outflow and the fact that source D seems to be driving the E–W outflow, source C appears to be the best candidate to power the N–S outflow.
NE–SW outflow
The NE–SW SiO molecular outflow proposed by Beltrán et al. (2018) and also visible in the CO channel maps of Cesaroni et al. (2011), which is located southward of the Main core, is visible at all velocity intervals, especially the redshifted emission. However, Beltrán et al. (2021) do not detect any dust continuum emission source at a 3 σ level of ~ 1 mJy beam−1 that could be a candidate to drive this outflow. Assuming a dust opacity of 1.0 cm2 g−1 at 1.4 mm (Ossenkopf & Henning 1994) for a Mathis, (Rumpl & Nordsieck 1977; MRN) distribution with thin ice mantles and a gas density of 108 cm−3), a mass-to-dust ratio of 100, and a dust temperature of 20 K, the mass of the driving source would be ≲ 0.3M⊙. This suggests that the source powering this outflow is a low-mass young stellar object. We note that if the dust temperature were > 20 K, then the mass would be even smaller.
NE outflow
The channel maps (Fig. 6) and, in particular, the averaged emission maps (Fig. 7) indicate the presence of an additional molecular outflow that could be associated with the NE core. This SiO outflow, named outflow NE, shows a very collimated blueshifted lobe with emission from low to high velocities. On the other hand, the redshifted emission is hardly visible very close to the position of the source.
Summarizing, for the first time the high-angular resolution SiO emission observations have resolved the complicated outflow emission in the Main core of G31 and suggest that each of the four dust continuum emission sources embedded in it could be driving a molecular outflow. This confirms what is already suggested by the redshifted absorption observed in CH3CN and H2CO, that is, that the sources are still actively accreting and are therefore gaining mass. Furthermore, these observations confirm that in the high-mass regime accretion also appears to be commonly associated with outflow activity. The bottom panel of Fig. 8 shows a close-up view of the SiO averaged emission toward the Main core overlaid with the H2O maser positions and proper motions from Moscadelli et al. (2013). The proper motions confirm the existence of expansion motions in the core. Except for a group of masers located northward of source B and a small group located at the southern edge of the SE outflow, the water maser positions and their proper motions are clearly associated with the four SiO outflows in the core: outflows SE, E–W, N–S, and SW.
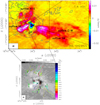 |
Fig. 8 Close-up view of the SiO outflow emission associated with sources A, B, C, and D. Top panel: Overlay of the ALMA 1.4 mm continuum emission (grayscale) on the SiO (5–4) emission averaged over the (93, 104) km s−1 velocity interval. Contour levels are the same as in Fig. 6. Bottom panel: Close-up of the central region. The colored circles give the position of H2O masers, while the colored vectors indicate the direction and the amplitude of the proper motions (Moscadelli et al. 2013). The white vector in the bottom left corner indicates the amplitude scale of proper motions in kilometers per second. The synthesized beam is drawn in the bottom left corner of each panel. The red crosses give the positions of the continuum sources embedded in the Main core (Beltrán et al. 2021). The black (white) lines indicate the direction of the outflows driven by sources A, B, C, and D. |
Outflow properties calculated from SiO.
3.2.2 Physical properties of the outflows
The physical properties of the SiO outflows were estimated by assuming a range of temperatures of 30 and 50 K, following Beltrán et al. (2018). The lower limit was set by the SiO peak brightness temperature. For the abundance of SiO relative to H2 we used a range of 10−8–10−7 (e.g., Codella et al. 2013). Table 2 shows the mass, Mout, of the six outflows detected in the region; their momentum, Pout; their kinetic energy, Eout; and their corresponding rates obtained by dividing the previous quantities by the dynamical timescale of each outflow, tdyn, average length of the redshifted and blueshifted lobes, ⟨Rlobe⟩, and the average redshifted and blueshifted maximum velocity of the outflow, Vmax, and tdyn. The dynamical timescales were calculated by dividing ⟨Rlobe⟩ by Vmax and, as seen in the table, are quite similar and on the order of 103 yr. We note that the outflow properties were not corrected for the (unknown) inclination angle, i, of the flowswith respect to the plane of the sky. When correcting for inclination, Vmax should be divided by sini and ⟨Rlobe⟩ by cos i, and tdyn should be multiplied by tani.
The outflows with the highest mass loss rate are outflow E–W associated with source D and outflow SW driven by source A, while the weakest one is outflow N–S driven by source C. Outflow SE is the one with the lowest velocities and the smallest lobes. However, Vmax and ⟨Rlobe⟩ should be considered lower limits because the emission of the redshifted lobe is highly blended with that of the redshifted lobe of outflow E–W.
We find no correlations between the properties of the outflows Ṁout and Mout and the infall parameters Ṁinf and  , nor with the mass of the sources. This is not surprising taking into account the missing flux of the extended SiO emission, the low statistics (only four sources), and the uncertainties in the derivation of the parameters, such as the SiO abundance which can vary by a factor of 10 or the radius associated with the infall velocity, which is needed to estimate Ṁinf.
4 Discussion
4.1 Accelerating infall
Beltrán et al. (2018) concluded that the infall was accelerating toward the center of the Main core by measuring the velocity of the absorption feature for different H2CO transitions and CH3CN and isotopolog transitions with different excitation energies and observing that the infall velocity increases with the line excitation energy. With the higher angular resolution of the observations presented here we can investigate whether the infall is accelerating within each source. The redshifted velocity was only calculated for those lines that are not heavily blended with other species, because blending affects the estimate. For a few transitions that are slightly blended, we estimated a lower limit for the velocity. In Fig. 9, we plot the redshifted velocity as a function of the excitation energy of the CH3CN (ground state and vibrationally excited), CH CN, 13CH3CN, and H2CO lines. As seen in this figure, for all but source A, the velocity of absorption is lower for the H2CO transitions, which have the lowest excitation energies. This suggests that H2CO is probably tracing the infall at the outer regions of the sources. Taking into account that the velocity of the absorption feature seen in the different H2CO transitions is similar for all the sources, these outer regions could indeed be located at the common envelope or the core surrounding the sources. Figure 9 shows that, albeit with some dispersion, the redshifted velocity for sources B, C, and D increases with the upper level energy of the transition, suggesting that infall could also be accelerating within the sources. Regarding source A, as mentioned in Sect. 3.1, the spectra of CH3CN clearly indicate the presence of different components at blueshifted and redshifted velocities, and therefore it is difficult to properly estimate the velocity of the redshifted absorption. This is evident in Fig. 9, where the dispersion of the estimates is too large to draw any conclusion about the infall.
4.2 Infall versus accretion
The four sources embedded in the Main core of G31 are associated simultaneously with infall and outflow. This is not surprising, as both mechanisms (ejection and collapse of material) are closely related to each other in the star formation process. The SiO observations have allowed us to derive the outflow rate, Ṁout, that, after taking into account a few assumptions, could allow us to estimate the mass accretion rate onto the central star, Ṁacc. Assuming conservation of the momentum rate between the outflow and the jet powering it, Ṁout is related to the mass loss rate of the internal jet Ṁjet as Ṁout = Ṁjet Vjet∕Vout. Assuming furthermore a ratio of the jet velocity, Vjet, to the molecular outflow velocity, Vout, we can estimate Ṁacc if we know the fraction of accreting gas that is launched in the jet. Beuther et al. (2002) estimated Vjet∕Vout ~ 20 analyzing CO outflows with a median velocity of ~ 15 km s−1. However, the outflows in G31 were observed in SiO, which is a shock tracer likely tracing a systematically higher outflow component than CO, which is tracing the bulk outflow gas. Therefore, Vjet∕Vout might be lower (~10) taking into account that the maximum outflow velocities measured scatter around 30 km s−1. Here, we have assumed that Vjet∕Vout is in the range 10–20. Regarding the ratio of ejection to accretion rates, Ṁjet∕Ṁacc, theoretical models predict a wide range of values. The X-wind and disk wind models predict that this ratio is in the range 0.1–0.3 (e.g., Tomisaka 1998; Shu et al. 1999; Offner & Arce 2014). However, ratios as low as 0.01 (or even lower) and as high as 0.5 have been theorized for certain magneto-centrifugally driven wind models (e.g., Nolan et al. 2017; Sheikhnezami et al. 2012). The Ṁjet∕Ṁacc ratio is poorly constrained not only theoretically, but also observationally (e.g., Calvet et al. 2004; Cabrit 2007; Agra-Amboage et al. 2009; Frank et al. 2014, and references therein). For our calculations here we assume a ratio in the range 0.1–0.3, which includes the values typically used in the literature. With these ranges of Vjet∕Vout and Ṁjet∕Ṁacc, we obtain that Ṁacc = 0.17–1 Ṁout. For sources A, B, C, and D, the infall rates are on the order of ~ 10−2 M⊙ yr−1 (see Table 1), while the accretion rates would be at most (assuming a gas temperature of 50 K and an abundance SiO range of 10−8–10−7) on the order of 10−4 M⊙ yr−1 (see Table 1).
This difference of about two orders of magnitude between Ṁinf and Ṁacc has also been observed in other low- to high-mass protostars (López-Sepulcre et al. 2010; see Fig. 16 of Beltrán & de Wit 2016). We note that the infall rates should be considered as upper limits because the radius at which Vinf corresponds might have been overestimated (see Sect. 3.2.1). On the other hand, for G31, the low values of the accretion rates could be explained in part in terms of SiO missing flux that would underestimate Ṁout, and therefore Ṁacc. To have an estimate of the SiO missing flux, we compared the total mass of the outflows in the region with the mass estimated by Cesaroni et al. (2011) from 13CO (2–1) IRAM 30 m and SMA combined data. The total SiO mass is ~ 1.8 M⊙ assuming the maximum outflow mass for each individual outflow in Table 2, as used to estimate Ṁacc, while the 13CO mass is 20 M⊙ (Cesaroni et al. 2011). Therefore, the missing flux could account for at least a factor of 10. Therefore, taking into account all the uncertainties in the estimates of Ṁinf and Ṁacc, the ratio Ṁinf∕Ṁacc could range from a few to 100. We believe that the true value most likely lies between these two extremes, and thus conclude that we cannot discard the possibility that the efficiency of the central star and the jet in removing material from the accretion disk is lower than expected, as suggested by Beltrán & de Wit (2016). The infalling material could pile up in the disk, which would increase its mass and ultimately become gravitationally unstable and fragment (e.g., Peters et al. 2011; Oliva & Kuiper 2020). This could lead to episodic accretion bursts onto the central object similar to those observed toward high-mass sources like S255 NIR 3 Caratti o Garatti et al. (2016), NGC 6334 I-MM1 (Hunter et al. 2017, 2018, 2021), G358.93−00.03 (Sugiyama et al. 2019), and W51-North Goddi et al. (2020), and theoretically quantified by Meyer et al. (2017, 2019) and Oliva & Kuiper (2020), among others.
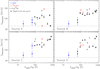 |
Fig. 9 Velocity of the absorption feature, measured toward the dust continuum peak of each source embedded in the Main core of G31 vs. the excitation energy of the corresponding CH3CN (12–11), CH |

4.3 Outflow feedback
Taking into account that all the sources embedded in the Main core of G31 are driving outflows, we investigated the impact of such outflows on the G31 core, and in particular we studied whether the outflow feedback is sufficient to sustain the turbulence in the Main core and also to disrupt the core itself. Because the extended emission of the outflows as traced in SiO with ALMA is significantly affected by missing flux as seen in the previous section, for our calculations we decided to use the properties of the outflows estimated by Cesaroni et al. (2011) from 13CO (2–1) IRAM 30 mand SMA combined data. The resolution of these observations (~ 1.′′7) is not high enough to resolve the individual outflows, but this is not important in this case because we are interested in the total properties of the outflows (momentum, momentum rate, energy, energy rate).
Following Stanke & Williams (2007), we first estimated whether the energy and momentum injected by the outflows were enough to sustain the turbulence in the core, which should decay on a sound crossing time,  . Assuming a temperature of 250 K, which is the mean value of the temperature in the core estimated by Beltrán et al. (2018), and a size of ~ 8000 au, the sound speed, cs, is ~ 1 km s−1, and
  is ~ 4 × 10⁴ yr. Following Stanke & Williams (2007), the turbulent energy can be estimated as
  , where Mcore is the mass of the Main core, which is ~ 70 M⊙ Cesaroni et al. (2019), and σ1D is the one-dimensional velocity dispersion, estimated to be 2.1 km s−1 by Beltrán et al. (2019). This estimate is essentially turbulent velocity dispersion because the thermal and rotation contributions to the line broadening are negligible, as discussed by Beltrán et al. (2019). Therefore, Eturb ~ 9 × 1045 erg. The rate atwhich the energy is lost due to decay of turbulence is then calculated as
  , and it is ~ 2 L⊙ for G31. The total mechanical luminosity of the outflows, Lmech, is ~ 55 L⊙, which is ~28 times higher than Lturb. These numbers are consistent if ~4% of the outflow momentum is transferred to the core and the remainder is dissipated by shocks or just leaves the core.
The rate Lgain at which the gas cloud gains energy, taking into account radiative losses, can be estimated following Stanke & Williams (2007) as  , where Ṗout is the total outflow momentum rate, estimated to be 0.057 M⊙ km s−1 yr−1 by Cesaroni et al. (2011). The energy gain rate is Lgain ~ 8 L⊙, similar to Lturb, which suggests that the molecular outflows in G31 can inject enough energy and momentum to sustain the turbulence in the core.
Following Rivilla et al. (2013), we evaluated whether the feedback of the outflows in the dense and compact Main core was enough to disrupt it. To do this, we compared the energy of the outflows, Eout, with the gravitational potential energy of the core, |Egrav|, which can be calculated as  , where Rcore is the radius of the core estimated to be ~ 1.′′1 (~ 4000 au) by Beltrán et al. (2018). Since the outflows are still deeply embedded in the core, especially outflows A and B, their energy is likely to be deposited locally, and therefore we do not expect considerable energy leakage. Cesaroni et al. (2011) calculated Eout ~ 3 × 1046 erg, while |Egrav| is ~ 2 × 1046 erg. Since the Main core in G31 is not in equilibrium but is apparently collapsing, to prevent further global collapse of the core the outflows should counteract not only the gravitational energy of the core, but also the kinetic energy of the infalling material, Ekin. Virial theorem considerations suggest Ekin ~ 1∕2 |Egrav|~ 1 × 1046 erg. Since the energy of the outflows is comparable to the sum of |Egrav| and Ekin, the outflowsin G31 could, in principle, prevent further global collapse of the core. We thus do not expect further star formation to occur in G31.
5 Conclusions
We carried out ALMA line observations at 1.4 mm of the high-mass star-forming region G31 at an angular resolution of ~ 0.′′09 (~ 340 au). The goal of these observations was to study the kinematics of the four sources, A, B, C, and D, embedded in the Main core of G31. In particular, our aim was to better investigate, at higher angular resolution, the outflows and the collapse in the core previously discovered by Beltrán et al. (2018).
The observations have revealed that the four sources are undergoing collapse, as suggested by the presence of redshifted absorption in CH3CN and H2CO. The infall velocities estimated from H2CO are ~ 2–3 km s−1 and the infall rates, which should be taken as upper limits, are on the order of ~ 10−2 M⊙ yr−1. The similarity between the free-fall times of the individual sources A to D and the accretion timescale of the Main core, estimated from the individual infall rates, suggests that the embedded sources evolve dynamically together with the Main core, and that the forming stars can tap into the entire reservoir of material in the core. The fact that the accretion timescale of the Main core is an order of magnitude smaller than its rotation timescale confirms that rotating toroids, such as the G31 Main core, are non-equilibrium transient collapsing structures, constantly replenished with fresh material from a large-scale reservoir.
The infall velocity estimated from CH3CN and isotopologs, and H2CO for source B, C, and D, increases with the upper level energy of the transition, which suggests that infall could be accelerating within the sources. For source A, the presence of a second absorption component complicates the estimation of the infall velocity.
The SiO observations indicate the presence of at least six outflows in the G31 star-forming region, and suggest that each of the four sources embedded in the Main core drives a molecular outflow. This confirms that the sources are still actively accreting material. The outflow rates are on the order of ~ 10−5–10−4 M⊙ yr−1, depending on the SiO abundance. The outflows with the highest mass loss rates are outflow E–W, associated with source D, and outflow SW, driven by source A, while the most embedded one is outflow SE, powered by source B. Outflow SE is also the one with the lowest velocity and smallest lobe size. The four outflows are likely associated with H2O maser emission.
The mass accretion rates onto the individual sources, estimated from the highest value of the mass loss rate, are on the order of 10−4 M⊙ yr−1, about two orders of magnitude smaller than the infall rates. This difference between Ṁacc and Ṁinf may be partly due to filtering of the extended outflow emission, uncertainties in the ejection to accretion ratio, or overestimation of the infall rates, but it could also be real and suggest inefficient removal of the disk material from the central star and the jet, which could lead to gravitational instabilities and episodic accretion events.
Our study indicates that infall and outflows are simultaneously present in all four sources embedded in the high-mass star-forming core G31.41+0.31. This indicates that these sources are still actively accreting and have not reached their final mass yet, and confirms that in the high-mass regime accretion also seems to be commonly associated with outflow activity. The energy and momentum available in the outflows have the potential to inject significant turbulence in the Main core and to eventually disrupt it or prevent its further collapse. This suggests that the number of sources associated with the small protocluster might remain unchanged.
Acknowledgements
We thank the anonymous referee for useful comments that have improved the manuscript. This paper makes use of the following ALMA data: ADS/JAO.ALMA#2013.1.00489.S and ADS/JAO.ALMA#2016.1.00223.S. ALMA is a partnership of ESO (representing its member states), NSF (USA) and NINS (Japan), together with NRC (Canada) and NSC and ASIAA (Taiwan), in cooperation with the Republic of Chile. The Joint ALMA Observatory is operated by ESO, AUI/NRAO and NAOJ. The National Radio Astronomy Observatory is a facility of the National Science Foundation operated under cooperative agreement by Associated Universities, Inc. V.M.R. acknowledges support from the Comunidad de Madrid through the Atracción de Talento Investigador Modalidad 1 (Doctores con experiencia) Grant (COOL: Cosmic Origins Of Life; 2019-T1/TIC-15379). H.B. acknowledges support from the European Research Council under the Horizon 2020 Framework Program via the ERC Consolidator Grant CSF-648405. H.B. also acknowledges support from the Deutsche Forschungsgemeinschaft in the Collaborative Research Center (SFB881) “The Milky Way System” (subproject B1). R.K. acknowledges financial support via the Emmy Noether and Heisenberg Research Grants funded by the German Research Foundation (DFG) under grant no. KU 2849/3 and 2849/9. M.S.N.K. acknowledges the support from FCT – Fundacão para a Ciência e a Tecnologia through Investigador contracts and exploratory project (IF/00956/2015/CP1273/CT0002).
Appendix A Mass infall rate
The infall rate in a spherically symmetric clump of radius Rc is given by theexpression
 (A.1)
(A.1)
where Ω is the solid angle subtended by the clump center over which infall occurs, Vinf the infall velocity, mH the mass of the H atom, μ = 2.8 the mean molecular weight, and  the number density of the H2 molecules. However, it is more convenient to replace the density at the clump radius with the mean density inside that radius,
  , as the latter is the quantity that is obtained from the observations. For this purpose we assume that the clump is undergoing free- fall collapse, Vinf ∝ r−1∕2, with r radius from the clump center. Mass conservation (i.e., Ṁinf = const.) implies that for any r the following condition must be satisfied,
 (A.2)
(A.2)
or, equivalently,
 (A.3)
(A.3)
which implies
 (A.4)
(A.4)
We can now compute the mean density inside the clump:
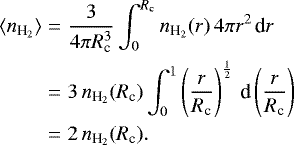 (A.5)
(A.5)
Finally, Eq. (A.1) can be written in the form
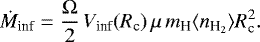 (A.6)
(A.6)
References
- Agra-Amboage, V., Dougados, C., Cabrit, S., Garcia, P. J. V., & Ferruit, P. 2009, A&A, 493, 1029 [NASA ADS] [CrossRef] [EDP Sciences] [Google Scholar]
- Arce, H. G., Shepherd, D., Gueth, F., et al. 2007, in Protostars and Planets V, eds. B. Reipurth, D. Jewitt, & K. Keil (Tucson: University of Arizona Press), 245 [Google Scholar]
- Arce, H. G., Santiago-García, J., Jørgensen, J. K., Tafalla, M., & Bachiller, R. 2008, ApJ, 681, L21 [NASA ADS] [CrossRef] [Google Scholar]
- Beltrán, M. T. 2011, in Computational Star Formation, Proceedings of the International Astronomical Union, IAU Symposium, 270, 33 [Google Scholar]
- Beltrán, M. T. 2020, in Perspective of the Star Formation Newsletter no. 329, [arXiv:2005.06912] [Google Scholar]
- Beltrán, M. T., & de Wit, W. J. 2016, A&ARv, 24, 6 [Google Scholar]
- Beltrán, M. T., Cesaroni, R., Neri, R., et al. 2004, ApJ, 601, L190 [Google Scholar]
- Beltrán, M. T., Cesaroni, R., Neri, R., et al. 2005, A&A, 435, 901 [Google Scholar]
- Beltrán, M. T., Cesaroni, R., Neri, R., Codella, C. 2011a, A&A, 525, A151 [NASA ADS] [CrossRef] [EDP Sciences] [Google Scholar]
- Beltrán, M. T., Cesaroni, R., Zhang, Q., et al. 2011b, A&A, 532, A91 [Google Scholar]
- Beltrán, M. T., Cesaroni, R., Rivilla, V. M., et al. 2018, A&A, 615, A141 [Google Scholar]
- Beltrán, M. T., Padovani, M., Girart, J. M., et al. 2019, A&A, 630, A54 [Google Scholar]
- Beltrán, M. T., Rivilla, V. M., Cesaroni, R., Maud, L. T. et al. 2021, A&A, 648, A100 [NASA ADS] [CrossRef] [EDP Sciences] [Google Scholar]
- Beuther, H., Schilke, P., Sridharan, T., et al. 2002, A&A, 383, 892 [NASA ADS] [CrossRef] [EDP Sciences] [Google Scholar]
- Briggs, D. 1995, PhD Thesis, New Mexico Inst., Mining & Tech. [Google Scholar]
- Cabrit, S. 2007, in IAU Symp. 243, Star-Disk Interaction in Young Stars, eds. J. Bouvie, & I. Appenzeller (Cambridge: Cambridge Univ. Press), 203 [CrossRef] [Google Scholar]
- Calvet, N., Muzerolle, J., Briceño, C., et al. 2004, AJ, 128, 1294 [NASA ADS] [CrossRef] [Google Scholar]
- Caratti o Garatti, A., Stecklum, B., Weigelt, G., et al. 2016, A&A, 589, L4 [NASA ADS] [CrossRef] [EDP Sciences] [Google Scholar]
- Cesaroni, R. 2019, A&A 631, A65 [NASA ADS] [CrossRef] [EDP Sciences] [Google Scholar]
- Cesaroni, R., Hofner, P., Araya, E., & Kurtz, S. 2010, A&A, 590, A50 (C10) [Google Scholar]
- Cesaroni, R., Beltrán, M. T., Zhang, Q., Beuther, H., & Fallscheer, C. 2011, A&A, 533, A73 [NASA ADS] [CrossRef] [EDP Sciences] [Google Scholar]
- Cesaroni, R., Sánchez-Monge, Á., Beltrán, M. T., et al. 2017, A&A, 602, A59 [NASA ADS] [CrossRef] [EDP Sciences] [Google Scholar]
- Chandler, C. J., Brogan, C. L., & Shirley, Y. L. 2005, ApJ, 632, 371 [NASA ADS] [CrossRef] [Google Scholar]
- Codella, C., Benedettini, M., Beltrán, M. T., et al. 2009, A&A, 507, L25 [NASA ADS] [CrossRef] [EDP Sciences] [Google Scholar]
- Codella, C., Beltrán, M. T., Cesaroni, R., et al. 2013, A&A, 550, A81 [NASA ADS] [CrossRef] [EDP Sciences] [Google Scholar]
- Frank, A., Ray, T. P., Cabrit, S., et al. 2014, in Protostars and Planets VI, eds. H. Beuther, R. S. Klessen, C. P. Dullemond, & Th. Henning (University of Arizona Press), 451 [Google Scholar]
- Gieser, C., Semenov, D., Beuther, H., et al. 2019, A&A, 631, A142 [NASA ADS] [CrossRef] [EDP Sciences] [Google Scholar]
- Gieser, C., Beuther, H., & Semenov, D. 2021, A&A, 648, A66 [NASA ADS] [CrossRef] [EDP Sciences] [Google Scholar]
- Girart, J. M., Beltrán, M. T., Zhang, Q., Rao, R., & Estalella, R. 2009, Science, 324, 1408 [NASA ADS] [CrossRef] [Google Scholar]
- Goddi, C., Ginsburg, A., Maud, L. T., Zhang, Q., & Zapata, L. A. 2010, ApJ, 905, 25 [Google Scholar]
- Ho, P. T. P., & Haschick, A. D. 1986, ApJ, 304, 501 [NASA ADS] [CrossRef] [Google Scholar]
- Hunter, T. R., Brogan, C. L., MacLeod, G., et al. 2017, ApJ, 837, L29 [NASA ADS] [CrossRef] [Google Scholar]
- Hunter, T. R., Brogan, C. L., MacLeod, G. C., et al. 2018, ApJ, 854, 170 [NASA ADS] [CrossRef] [Google Scholar]
- Hunter, T. R., Brogan, C. L., De Buizer, J. M., et al. 2021, ApJ, 912, L17 [CrossRef] [Google Scholar]
- Immer, K., Li, J., Quiroga-Nuñez, L. H., et al. 2019, A&A, 632, A123 [NASA ADS] [CrossRef] [EDP Sciences] [Google Scholar]
- Keto, E. R., Ho, P. T. P., & Haschick, A. D. 1988, ApJ, 324, 920 [NASA ADS] [CrossRef] [Google Scholar]
- Krumholz, M. R. 2015, in Very Massive Stars in the Local Universe, Astrophys. Space Sci. Libr., 412, 43 [NASA ADS] [Google Scholar]
- Kuiper, R., & Hosokawa, T. 2018, A&A, 616, A101 [NASA ADS] [CrossRef] [EDP Sciences] [Google Scholar]
- López-Sepulcre, A., Cesaroni, R., & Walmsley, C. 2010, A&A, 517, A66 [NASA ADS] [CrossRef] [EDP Sciences] [Google Scholar]
- Mathis, J. S., Rumpl, W., & Nordsieck, K. H. 1977, ApJ, 217, 425 [Google Scholar]
- Meyer, D. M.-A., Vorobyov, E. I., Kuiper, R., & Kley, W. 2017, MNRAS, 464, L90 [NASA ADS] [CrossRef] [Google Scholar]
- Meyer, D. M.-A., Vorobyov, E. I., Elbakyan, V. G., et al. 2019, MNRAS, 482, 5459 [NASA ADS] [CrossRef] [Google Scholar]
- Moscadelli, L., Li, J. J., Cesaroni, R., et al. 2013, A&A, 549, A122 [NASA ADS] [CrossRef] [EDP Sciences] [Google Scholar]
- Moscadelli, L., Rivilla, V. M., Cesaroni, R., et al. 2018, A&A, 616, A66 [NASA ADS] [CrossRef] [EDP Sciences] [Google Scholar]
- Moscadelli, L., Cesaroni, R. Beltrán, M. T., & Rivilla, V. M. 2021, A&A, 650, A142 [NASA ADS] [CrossRef] [EDP Sciences] [Google Scholar]
- Motte, F., Bontemps, S., & Louvet, F. 2018, ARA&A, 56, 41 [NASA ADS] [CrossRef] [Google Scholar]
- Nolan, C. A., Salmeron, R., Federrath, C., et al. 2017, MNRAS, 471, 1488 [NASA ADS] [CrossRef] [Google Scholar]
- Offner, S. S. R., & Arce, H. G. 2014, ApJ, 784, 61 [NASA ADS] [CrossRef] [Google Scholar]
- Oliva, G. A., & Kuiper, R. 2020, A&A, 644, A41 [NASA ADS] [CrossRef] [EDP Sciences] [Google Scholar]
- Olmi, L., Cesaroni, R., & Walmsley, C. M. 1996, A&A, 307, 599 [NASA ADS] [Google Scholar]
- Osorio, M., Anglada, G., Lizano, S., & D’Alessio, P. 2009, ApJ, 694, 29 [Google Scholar]
- Ossenkopf, V.,& Henning, Th. 1994, A&A, 291, 943 [Google Scholar]
- Palau, A., Walsh, C., Sánchez-Monge, Á., et al. 2017, MNRAS, 467, 2723 [NASA ADS] [Google Scholar]
- Peters, T., Banerjee, R., Klessen, R. S., & Mac Low, M.-M. 2011, ApJ, 729, 72 [Google Scholar]
- Rivilla, V. M., Martín-Pintado, J., Sanz-Forcada, J., et al. 2013, MNRAS, 434, 2313 [NASA ADS] [CrossRef] [Google Scholar]
- Rivilla, V. M., Beltrán, M. T., Cesaroni, R., et al. 2017, A&A, 598, A59 [NASA ADS] [CrossRef] [EDP Sciences] [Google Scholar]
- Sánchez-Monge, Á., Schilke, P., Ginsburg, A., Cesaroni, R., & Schmiedeke, A. 2018, A&A, 609, A101 [Google Scholar]
- Sheikhnezami,S., Fendt, Ch., Porth, O., et al. 2012, ApJ, 757, 65 [NASA ADS] [CrossRef] [Google Scholar]
- Shepherd, D. S., & Churchwell, E. 1996, ApJ, 472, 225 [NASA ADS] [CrossRef] [Google Scholar]
- Shu, F. H., Adams, F. C., & Lizano, S. 1987, ARA&A, 25, 23 [Google Scholar]
- Shu, F., Allen,A., Shang, H., Ostriker, E., & Li, Z.-Y. 1999, in NATO Advanced Science Institutes (ASI) Series C, eds. C. Lada, & N. Kylafis, 540, 193 [Google Scholar]
- Stanke, T., & Williams, J. P. 2007, AJ, 133, 1307 [NASA ADS] [CrossRef] [Google Scholar]
- Sugiyama, K., Saito, Y., Yonekura, Y., & Momose, M. 2019, ATel, 12446, 1 [Google Scholar]
- Tomisaka, K. 1998, ApJ, 502, L163 [CrossRef] [Google Scholar]
- van der Tak, F. F. S., Shipman, R. F., Jacq, T., et al. 2019, A&A, 625, A103 [NASA ADS] [CrossRef] [EDP Sciences] [Google Scholar]
- Wyrowski, F., Schilke, P., & Walmsley, C. M. 1999, A&A, 341, 882 [NASA ADS] [Google Scholar]
- Wyrowski, F., Gibb, A. G., & Mundy, L. G. 2002, in Hot Star Workshop III: The Earliest Stages of Massive Star Birth. ASP Conference Proceedings, 267, 43 [NASA ADS] [Google Scholar]
- Wyrowski, F., Güsten, R., Menten, K. M., et al. 2012, A&A, 542, L15 [NASA ADS] [CrossRef] [EDP Sciences] [Google Scholar]
The CASA package is available at http://casa.nrao.edu/
The GILDAS package is available at http://www.iram.fr/IRAMFR/GILDAS
All Tables
All Figures
|
Fig. 1 Overlay of the ALMA 1.4 mm continuum emission (white contours) of G31.41+0.31 on the integrated intensity (moment 0) map (colors) of CH3CN K = 4 (Eup ∕kB = 183 K). The line emission has been integrated over the velocity range 92–102 km s−1. The contours are 3, 6, 9, 15, 30, 60, 90, 120, and 165 times 1 σ, which is 0.32 mJy beam−1. The red crosses indicate the positions of the sources detected in the region by Beltrán et al. (2021). The synthesized beam of the 1.4 mm continuum emission (0.′′11 × 0.′′08, PA = − 83°) and CH3CN K = 4 (0.′′11 × 0.′′08, PA = − 57°) are shown in the lower left and right corner, respectively. |
| In the text | |
|
Fig. 2 Moment maps of CH3CN and isotopologs. Top panels: Overlay of the ALMA 1.4 mm continuum emission (contours) on the integrated intensity (moment 0) map (colors) of CH |
| In the text | |
|
Fig. 3 CH3CN (12–11) spectra of the K = 0, 1, 2, 3, and 4 transitions averaged over a beam toward the position of the dust continuum emission peak of the four sources embedded in the Main core of G31. The black lines indicate the different K components shifted to the frequency of the ambient gas velocity (96.5 km s−1). The red arrows in the top left panel indicate the secondary absorption component at blueshifted velocities associated with source A. |
| In the text | |
|
Fig. 4 Same as Fig. 3, but for the CH3CN (12–11) K = 3 transition. The x-axis is in units of velocity. The vertical dashed line indicates the systemic LSR velocity of 96.5 ± 0.5 km s−1 (Beltrán et al. 2018). The black, red, and green dotted vertical lines indicate the velocity of the deepest absorption toward sources A, B, and C, respectively. The black arrow indicates the secondary absorption component at blueshifted velocities associated with source A. |
| In the text | |
|
Fig. 5 Same as Fig. 3, but for H2CO (30,3 –20,2) (Eup ∕kB = 21 K), (32,2 –22,1) (Eup ∕kB = 68 K), and (32,1–22,0) (Eup ∕kB = 68 K). The x-axis is in units of velocity. The vertical dashed line indicates the systemic LSR velocity of 96.5 ± 0.5 km s−1 (Beltrán et al. 2018). |
| In the text | |
|
Fig. 6 Velocity channel maps of the SiO (5–4) line emission (colors) overlaid on the 1.4 mm continuum emission (grayscale). Each box contains pairs of maps corresponding to the blue- (blue contours) and redshifted (red contours) emission at about the same velocity offset (in absolute value) from the systemic velocity (96.5 ± 0.5 km s−1). The corresponding LSR velocities are indicated at the top right of the box. The conversion factor from Jy beam−1 to K, in the Rayleigh-Jeans approximation, is 2844. Contour levels are 3, 6, 9, 12, 15, and 20 times 0.55 mJy beam−1. Grayscale levels are 3, 20, 83, and 165 times 1 σ times 0.32 mJy beam−1. The synthesized beam of 0.′′11 × 0.′′08, PA = − 83°, is shown in the lower left corner of each panel. The black dotted lines indicate the direction of the six outflows identified in G31 in this work. The labels of the outflows are indicated in the bottom right panel. The yellow crosses indicate the positions of the four continuum sources embedded in the Main core and the green crosses give the positions of the rest of the continuum sources detected in the region (Beltrán et al. 2021). |
| In the text | |
|
Fig. 6 Continued. Colored contour levels are 3, 6, 9, 12, 15, 20, and 30 times 0.7 mJy beam−1. The bottom right panel is a close-up of the central region to better show the 1.4 mm continuum emission and the position of sources A, B, C, D, and NE. Grayscale and contour levels are 3, 6, 24, 48, 96, and 165 times 1 σ times 0.32 mJy beam−1. |
| In the text | |
|
Fig. 7 Overlay of the ALMA 1.4 mm continuum emission (grayscale) on the blueshifted (blue contours) and redshifted (red contours) SiO (5–4) emission averaged over different velocity intervals for the six outflows detected in the region. The velocity ranges within which the blueshifted and redshifted emission were averaged is indicated in square brackets in each panel. The systemic LSR velocity of G31 is 96.5 km s−1. Contour levels are 3, 6, 12, and 24 times 0.35 mJy beam−1 (blue and red) for the E–W and NE–SW outflows; 0.6 mJy beam−1 (blue) and 0.4 mJy beam−1 (red) for the SW outflow; 1.0 mJy beam−1 (blue) and 1.5 mJy beam−1 (red) for the SE outflow; 0.36 mJy beam−1 (blue) and 0.4 mJy beam−1 (red) for the N–S outflow; and 0.22 mJy beam−1 (blue) and 0.32 mJy beam−1 (red) for the NE outflow. The conversion factor from Jy beam−1 to K is 2844. Grayscale contours for the continuum emission are 0.96, 3.2, 6.4, 14.4, 28.8, and 54.4 mJy beam−1. The black dotted line indicates the direction of the outflow and the green cross the position of the suggested driving source. |
| In the text | |
|
Fig. 8 Close-up view of the SiO outflow emission associated with sources A, B, C, and D. Top panel: Overlay of the ALMA 1.4 mm continuum emission (grayscale) on the SiO (5–4) emission averaged over the (93, 104) km s−1 velocity interval. Contour levels are the same as in Fig. 6. Bottom panel: Close-up of the central region. The colored circles give the position of H2O masers, while the colored vectors indicate the direction and the amplitude of the proper motions (Moscadelli et al. 2013). The white vector in the bottom left corner indicates the amplitude scale of proper motions in kilometers per second. The synthesized beam is drawn in the bottom left corner of each panel. The red crosses give the positions of the continuum sources embedded in the Main core (Beltrán et al. 2021). The black (white) lines indicate the direction of the outflows driven by sources A, B, C, and D. |
| In the text | |
|
Fig. 9 Velocity of the absorption feature, measured toward the dust continuum peak of each source embedded in the Main core of G31 vs. the excitation energy of the corresponding CH3CN (12–11), CH |
| In the text | |
Current usage metrics show cumulative count of Article Views (full-text article views including HTML views, PDF and ePub downloads, according to the available data) and Abstracts Views on Vision4Press platform.
Data correspond to usage on the plateform after 2015. The current usage metrics is available 48-96 hours after online publication and is updated daily on week days.
Initial download of the metrics may take a while.