Fig. 5.
Download original image
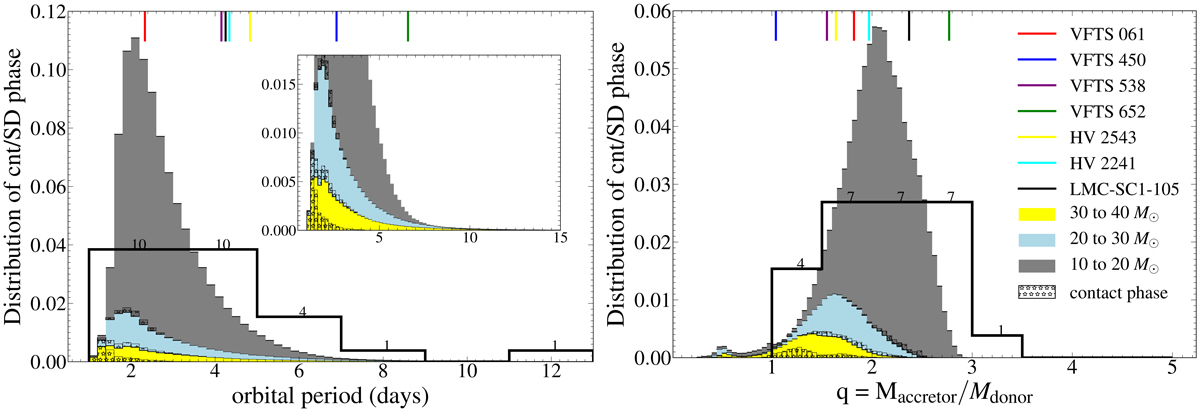
Distribution of orbital periods (left panel) and mass ratios (right panel) of our models during the semi-detached phase (unhatched) or contact phase (hatched with stars) of Case A mass transfer. Colour coding marks three different initial mass ranges, as indicated. The ordinate values are normalised such that the sum of the number fractions in all bins equals unity. Vertical lines at the top of the plots denote the orbital periods and mass ratios of observed Algol systems in the LMC (Table 1), identified through their colour (see legend, same for both panels). The inset in the left panel shows a zoomed-in distribution of the yellow and blue models. The black step-histogram denotes the distribution of orbital periods and mass ratios of 26 observed massive Algol systems in the Milky Way (Table 2). It is normalised such that the area under both the histograms is same. The number of stars contributing to each bin is given on top of each bin.
Current usage metrics show cumulative count of Article Views (full-text article views including HTML views, PDF and ePub downloads, according to the available data) and Abstracts Views on Vision4Press platform.
Data correspond to usage on the plateform after 2015. The current usage metrics is available 48-96 hours after online publication and is updated daily on week days.
Initial download of the metrics may take a while.