Fig. 10.
Download original image
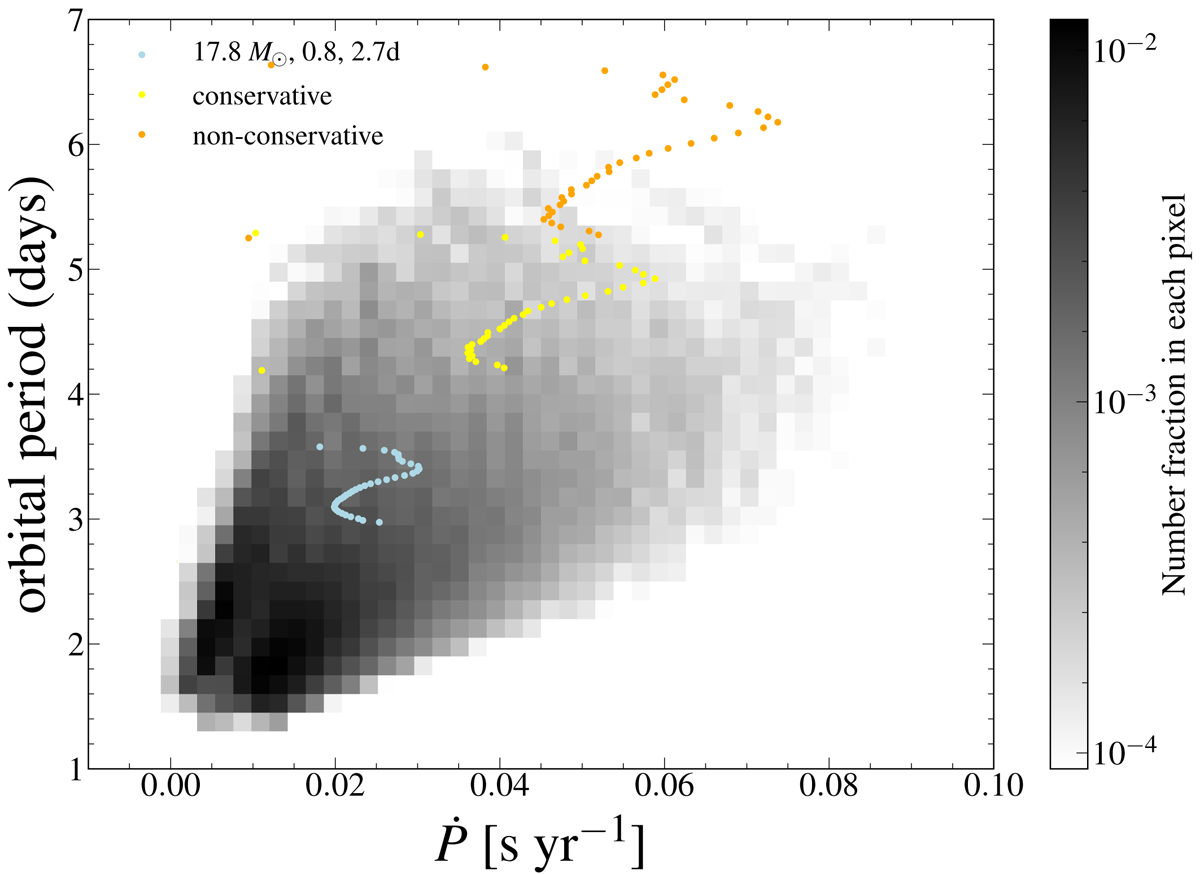
Probability distribution of the orbital period and its derivative that is predicted to be observed in the semi-detached configuration of the Case A mass transfer phase based on the model grid. The lightblue coloured dots show the evolution of the orbital period and its derivative during the semi-detached phase for our example model in Fig. 2. The yellow and orange dots show the evolution for the same model if the mass transfer phase was modelled as totally conservative (Eq. (5)) or totally non-conservative with the mass lost via isotropic re-emission (Eq. (29) of Quast et al. 2019), respectively. The dots are placed at intervals of 50 000 years with the first dots of each colour having the lowest orbital period. Grey-scale: See description in Fig. 7.
Current usage metrics show cumulative count of Article Views (full-text article views including HTML views, PDF and ePub downloads, according to the available data) and Abstracts Views on Vision4Press platform.
Data correspond to usage on the plateform after 2015. The current usage metrics is available 48-96 hours after online publication and is updated daily on week days.
Initial download of the metrics may take a while.