Fig. 1.
Download original image
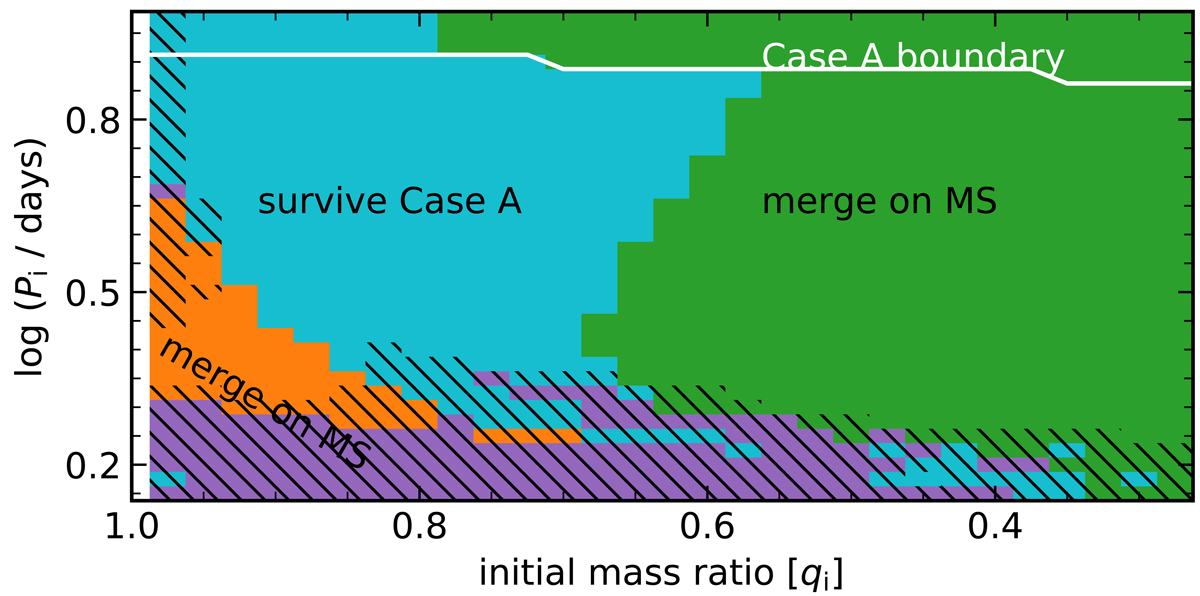
Summary plot of binary models with an initial donor mass of 22.4 M⊙, as a function of the initial binary orbital period and mass ratio. Each pixel in the plot represent the outcome of one binary model with the corresponding orbital period and mass ratio. The white line shows the maximum initial orbital period below which models undergo Case A mass transfer. The light blue coloured models survive the Case A mass transfer phase. The models marked in green are terminated during the fast Case A mass transfer phase. The purple models undergo mass overflow from the L2 Lagrangian point during core hydrogen burning. The orange models undergo inverse mass transfer onto the initially more massive Roche-lobe filling star while it is burning hydrogen, from the initially less massive component that has completed core hydrogen burning. Models that enter into a contact configuration, at any point of time during their main sequence evolution, are marked with hatching.
Current usage metrics show cumulative count of Article Views (full-text article views including HTML views, PDF and ePub downloads, according to the available data) and Abstracts Views on Vision4Press platform.
Data correspond to usage on the plateform after 2015. The current usage metrics is available 48-96 hours after online publication and is updated daily on week days.
Initial download of the metrics may take a while.