Fig. 2.
Download original image
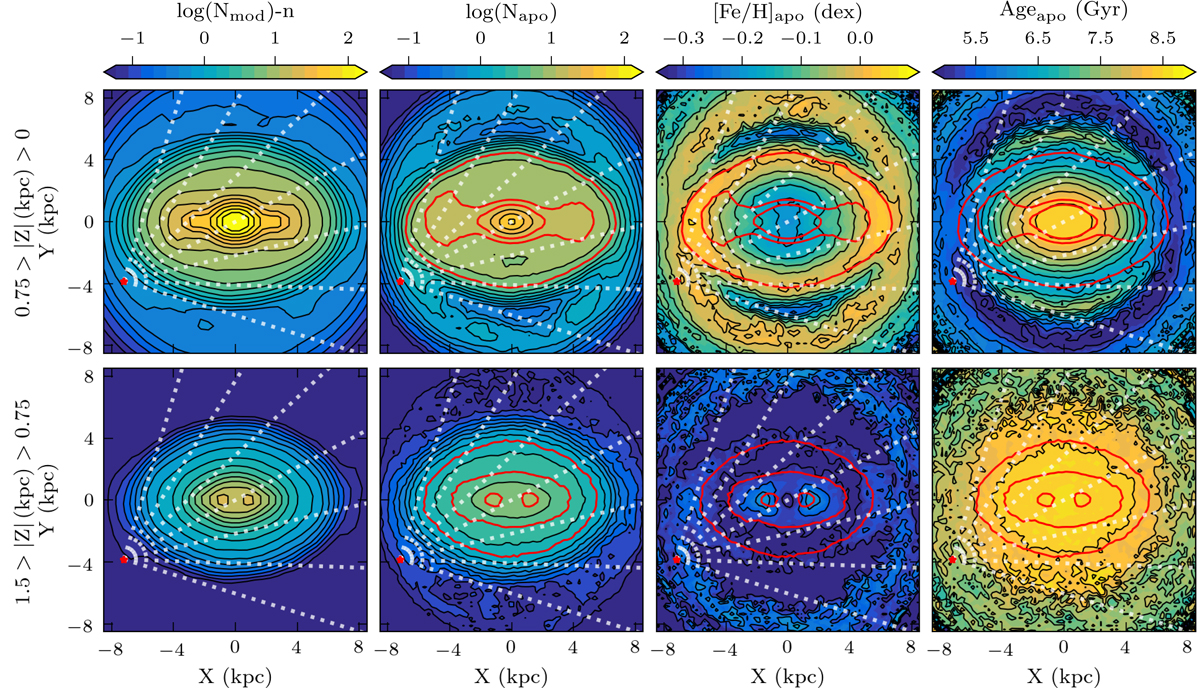
Orbital maps of the model and the APOGEE stars at different heights above the plane, using only Y-symmetric orbits with −1 ≤ [Fe/H] (dex) < 0.5. Left two columns: density maps built from the superposition of the model (left) and APOGEE stellar (right) orbits. The model density map has been normalised to a similar scale as the APOGEE density map using the factor n. Right two columns: mean [Fe/H] (left) and AstroNN age (right) APOGEE orbital maps. Top panels: orbital maps of the stars closer to the plane. In all plots, the red star marks the position of the Sun, while the white dashed lines mark sight lines at the following longitudes: 0°, ±15°, ±30°, and ±45°. The red contours in the APOGEE maps show the specific density levels that were chosen to highlight important features and to guide the eye. The APOGEE SF has not been corrected for.
Current usage metrics show cumulative count of Article Views (full-text article views including HTML views, PDF and ePub downloads, according to the available data) and Abstracts Views on Vision4Press platform.
Data correspond to usage on the plateform after 2015. The current usage metrics is available 48-96 hours after online publication and is updated daily on week days.
Initial download of the metrics may take a while.