Fig. 1.
Download original image
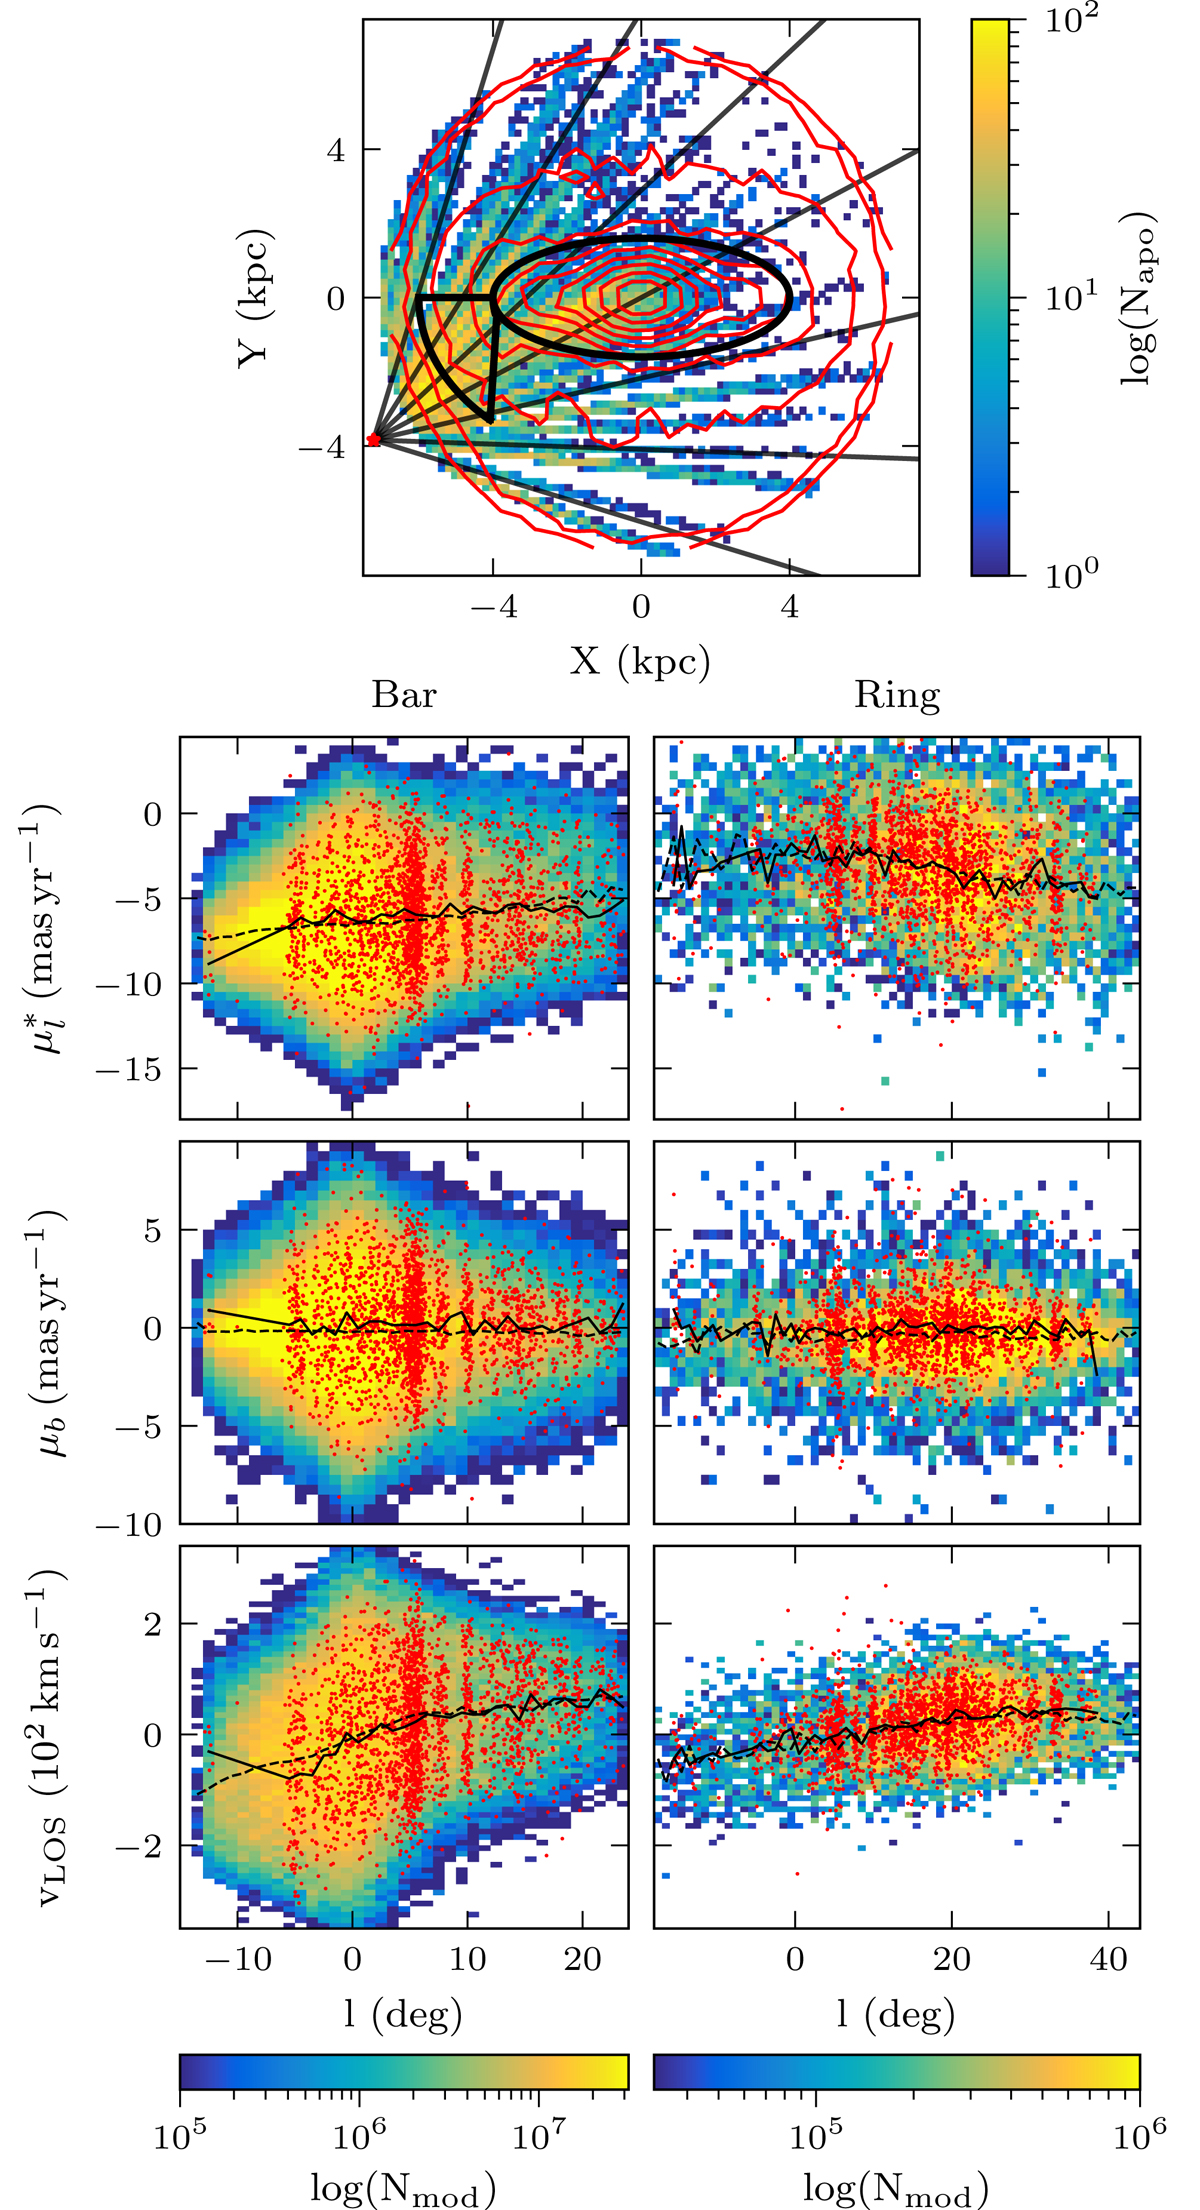
Comparisons of the model particles and APOGEE stars. Top: bar frame density distributions of the model particles (red contours) and APOGEE stars, both restricted to |b|< 13° and RGC < 7 kpc. The straight grey lines mark sight lines at longitudes of 0°, ±15°, ±30°, and ±45° and the red star shows the Sun’s position. Bottom: comparison of the heliocentric velocity distributions of model particles (2D histograms) and APOGEE stars (red points) with |b|< 3° in the bar region (left column, black ellipse in the top plot) and in a nearby section of a ring around the bar (right column, black arc in the top plot). Dashed and solid lines give the running means of the model and APOGEE distributions, respectively.
Current usage metrics show cumulative count of Article Views (full-text article views including HTML views, PDF and ePub downloads, according to the available data) and Abstracts Views on Vision4Press platform.
Data correspond to usage on the plateform after 2015. The current usage metrics is available 48-96 hours after online publication and is updated daily on week days.
Initial download of the metrics may take a while.