Fig. 9
Download original image
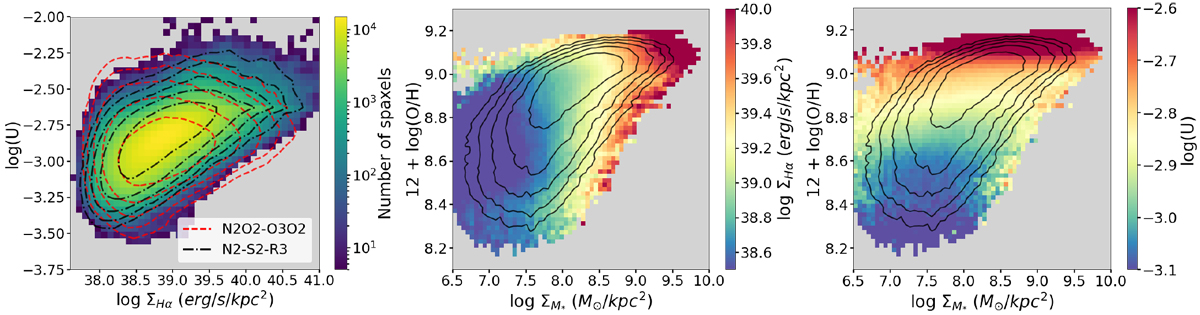
Correlation between the ionization parameter and Hα surface brightness (left), and the mass-metallicity relation color coded by the Hα surface brightness (middle) and ionization parameter (right). Left panel: 2D histogram of the logarithmic ionization parameter and logarithmic Hα surface brightness. The density distribution shows the results obtained by the JY20 model using all five line ratios. Thedashed red contours and the dotted-dashed black contours show the distributions obtained by using N2O2–O3O2 ratios and N2–S2–R3 ratios, respectively. The contour levels are in logarithmic scales and range from the 16th percentile to the 84th percentile. Middle panel: spatially resolved mass-metallicity relation of the sample spaxels color coded by themedian Hα surface brightness inside each bin. The black contours represent the density distribution of spaxels obtained by using all five line ratios. Right panel: same as the middle panel, but color coded by the median ionization parameter inside each bin.
Current usage metrics show cumulative count of Article Views (full-text article views including HTML views, PDF and ePub downloads, according to the available data) and Abstracts Views on Vision4Press platform.
Data correspond to usage on the plateform after 2015. The current usage metrics is available 48-96 hours after online publication and is updated daily on week days.
Initial download of the metrics may take a while.