Fig. 7
Download original image
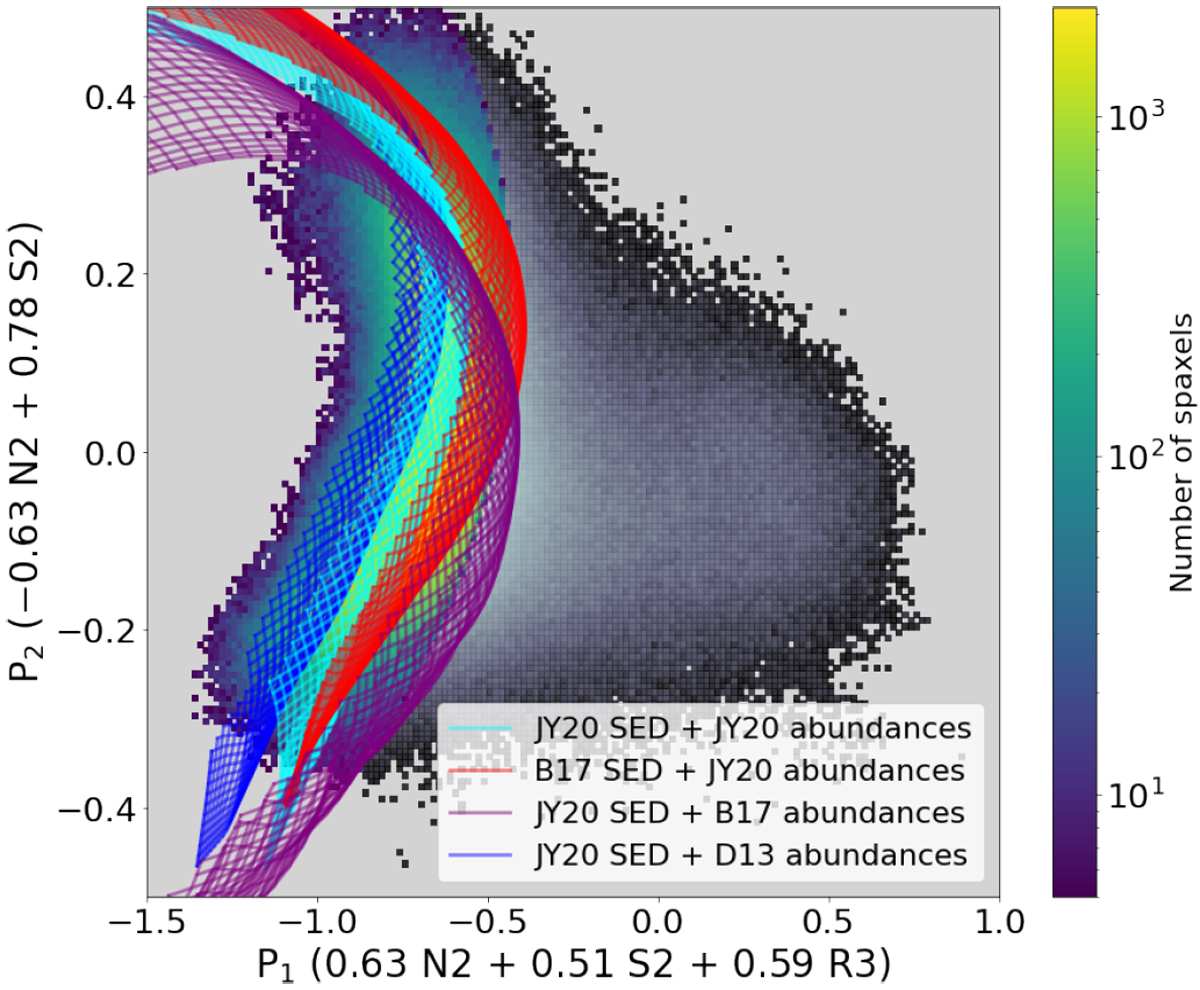
Comparisons of photoionization models with different input parameters in the P1 –P2 diagram. The cyan model is our fiducial model. The red model has the fiducial abundances and depletion set, but uses the SED adopted by the B17 model. The purple model uses the fiducial SED, but adopts the abundances and depletion set of the B17 model. The blue model uses the fiducial SED, but adopts the abundances and depletion set of the D13 model. The modelsare interpolated and cut so that only the parts that cover the middle 98% of the data along the hidden P3 axis are shown. The density distribution of the H II region sample is plotted in green and yellow, while the rest of the MaNGA sample is plotted in black and white.
Current usage metrics show cumulative count of Article Views (full-text article views including HTML views, PDF and ePub downloads, according to the available data) and Abstracts Views on Vision4Press platform.
Data correspond to usage on the plateform after 2015. The current usage metrics is available 48-96 hours after online publication and is updated daily on week days.
Initial download of the metrics may take a while.