Fig. 4

Download original image
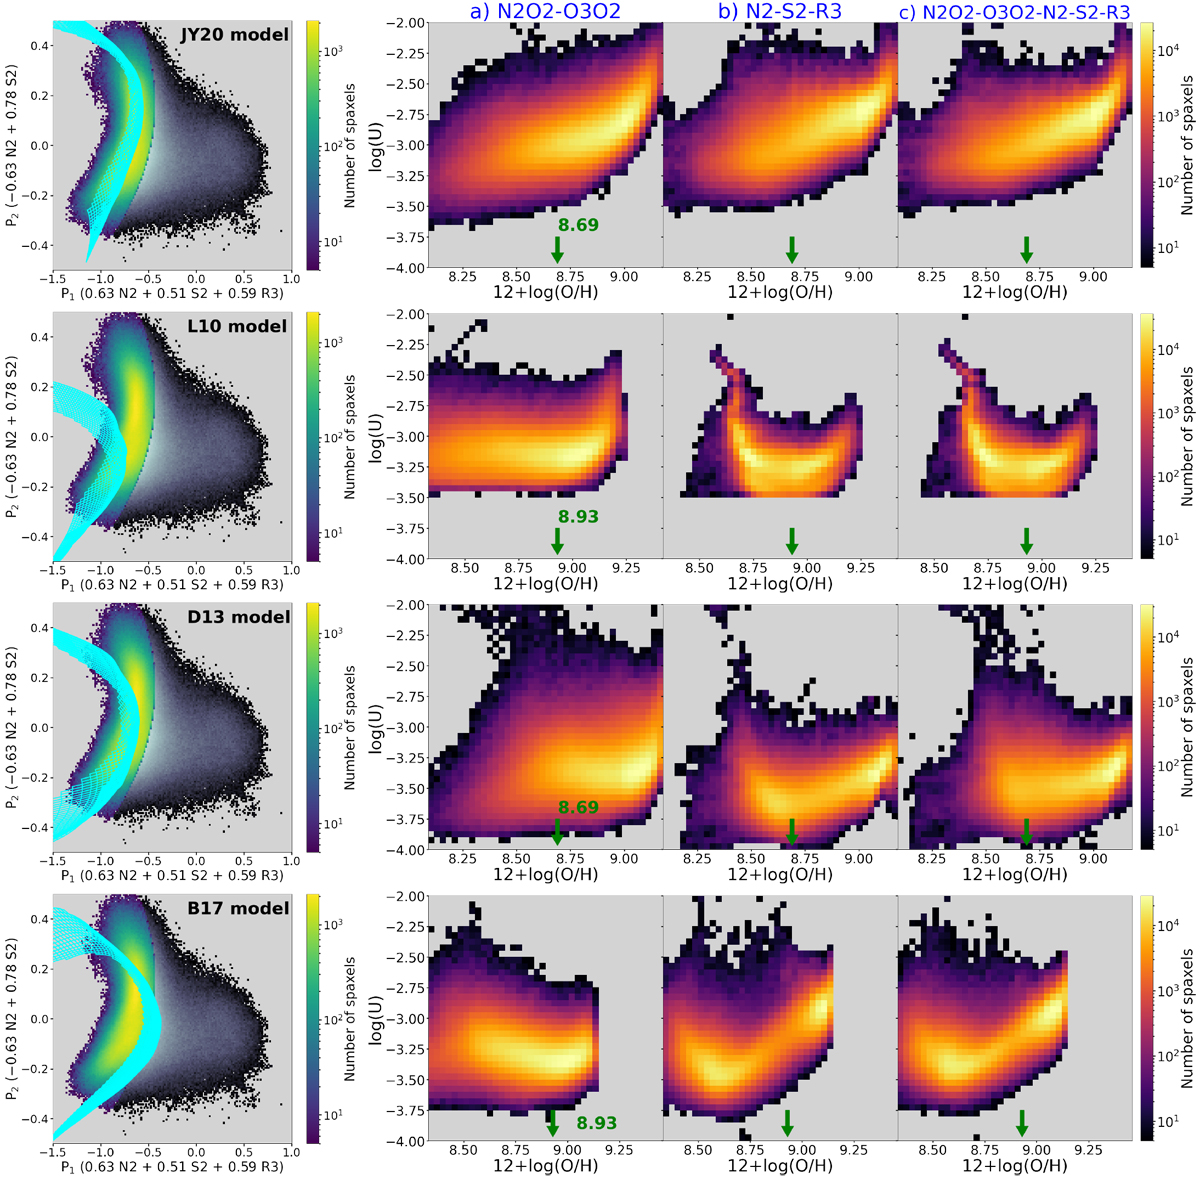
Different photoionization models viewed in the P1–P2 diagram and their predicted relations between the metallicity and ionization parameter. Leftmost column: Different SF-ionized models and MaNGA MPL-7 data in the P1 –P2 diagram. The models were interpolated and cut so that only the parts that cover the middle 98% of the data along the hidden P3 axis are shown. The spaxels with contributions from SF ionization greater than 90% are colored from yellow to green, while the rest of the spaxels are colored from white to black. Only the former were used to derive the metallicities and ionization parameters. Right columns (a) to (c): derived metallicities and ionization parameters using different SF-ionized models and different combinations of line ratios. In each panel, the green arrow marks the solar oxygen abundance adopted by the corresponding model.
Current usage metrics show cumulative count of Article Views (full-text article views including HTML views, PDF and ePub downloads, according to the available data) and Abstracts Views on Vision4Press platform.
Data correspond to usage on the plateform after 2015. The current usage metrics is available 48-96 hours after online publication and is updated daily on week days.
Initial download of the metrics may take a while.


