Free Access
Fig. 3
Download original image
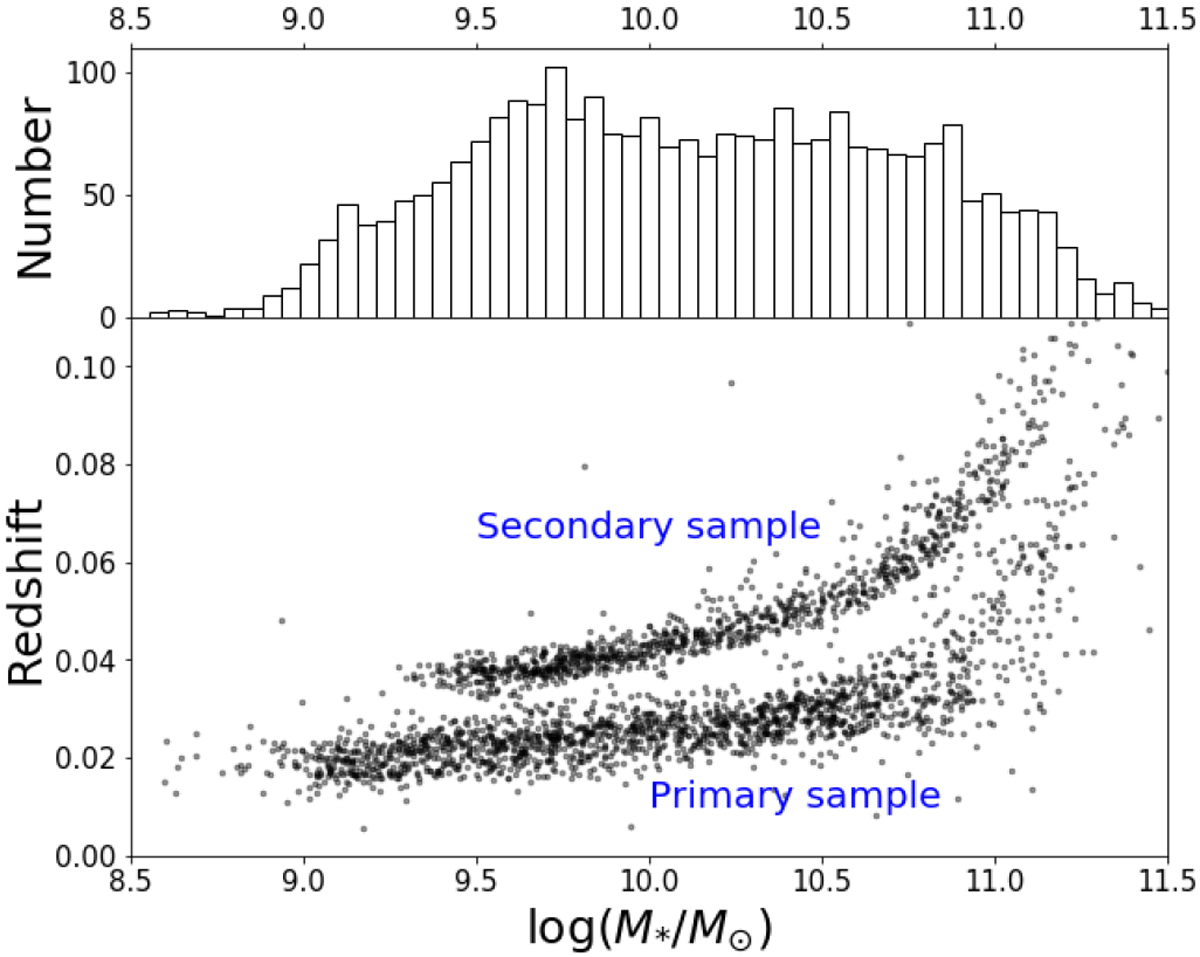
Redshift and stellar mass distributions of our sample galaxies. The histogram shows a relatively flat distribution in stellar mass. The sample galaxies include both primary and secondary MaNGA galaxies. The former cover spatial regions out to 1.5 Re, while the latter cover spatial regions out to 2.5 Re.
Current usage metrics show cumulative count of Article Views (full-text article views including HTML views, PDF and ePub downloads, according to the available data) and Abstracts Views on Vision4Press platform.
Data correspond to usage on the plateform after 2015. The current usage metrics is available 48-96 hours after online publication and is updated daily on week days.
Initial download of the metrics may take a while.