Fig. 2
Download original image
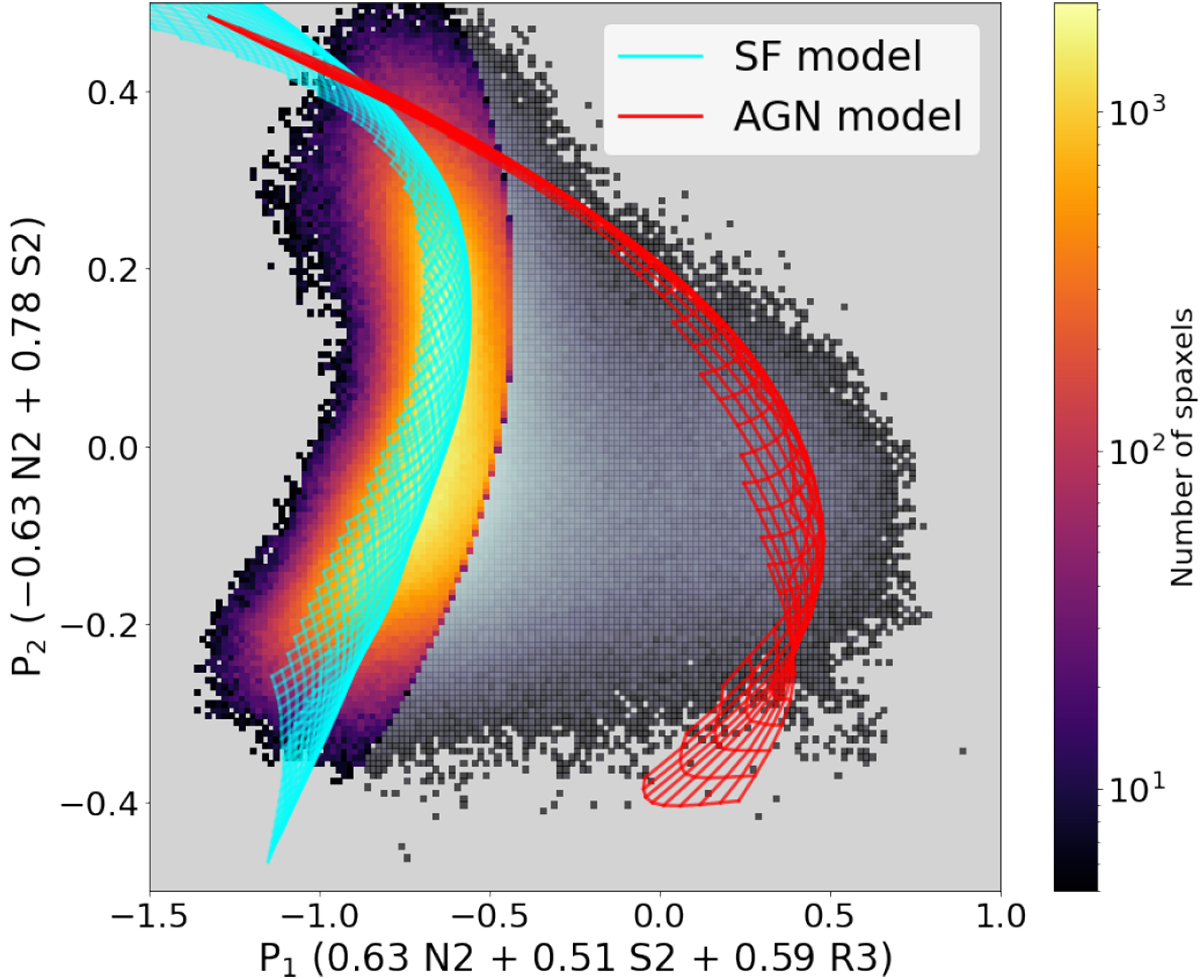
Density distribution of the MaNGA data in the 2D P1–P2 diagram, where the relevant parts of the (interpolated) SF model (cyan grid) and AGN model (red grid) appear edge-on and well separated. The sample H II regions are colored from yellow to purple. Here, we only plotted the parts of the model surfaces that cover the middle 98% of the data along the P3 axis (line of sight), which is perpendicular to the P1 versus P2 plane. This projection corresponds to a line of sight at (θ, ϕ) = (36°, 219°) in the 3D space of (N2, S2, R3), where θ and ϕ are the polar angle and the azimuthal angle, respectively (Ji & Yan 2020).
Current usage metrics show cumulative count of Article Views (full-text article views including HTML views, PDF and ePub downloads, according to the available data) and Abstracts Views on Vision4Press platform.
Data correspond to usage on the plateform after 2015. The current usage metrics is available 48-96 hours after online publication and is updated daily on week days.
Initial download of the metrics may take a while.