Fig. 10
Download original image
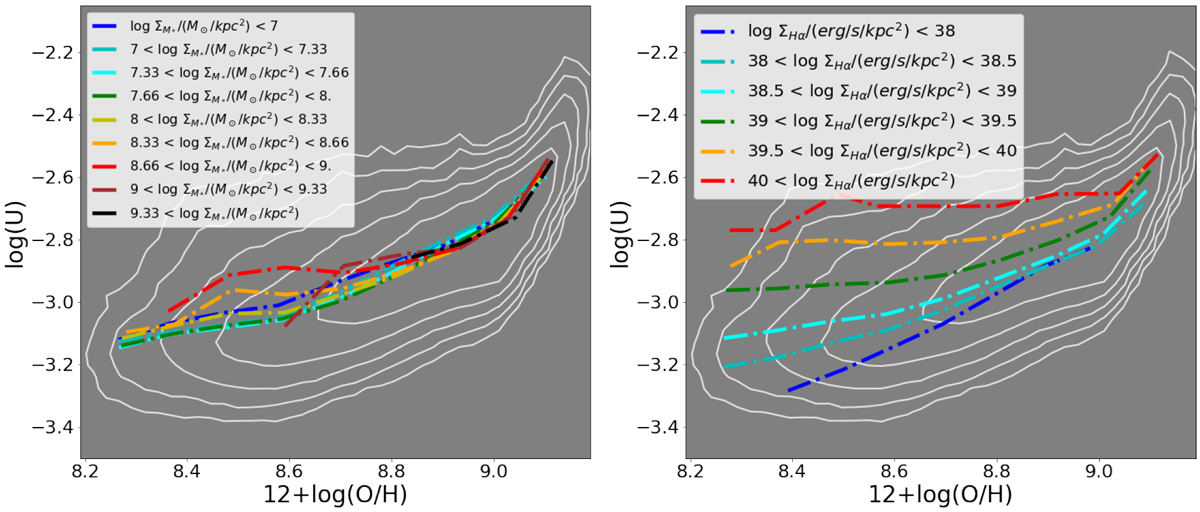
Dependence of the log(U) versus 12 + log(O/H) relation on the stellar mass surface density (left) and Hα surface brightness (right). The ionization parameters and metallicities shown were derived using all five line ratios. The contours represent five density levels equally spaced in the logarithmic space from the 16th percentile to the 84th percentile. The dotted-dashed lines indicate the median relations in different bins.
Current usage metrics show cumulative count of Article Views (full-text article views including HTML views, PDF and ePub downloads, according to the available data) and Abstracts Views on Vision4Press platform.
Data correspond to usage on the plateform after 2015. The current usage metrics is available 48-96 hours after online publication and is updated daily on week days.
Initial download of the metrics may take a while.