Fig. 1
Download original image
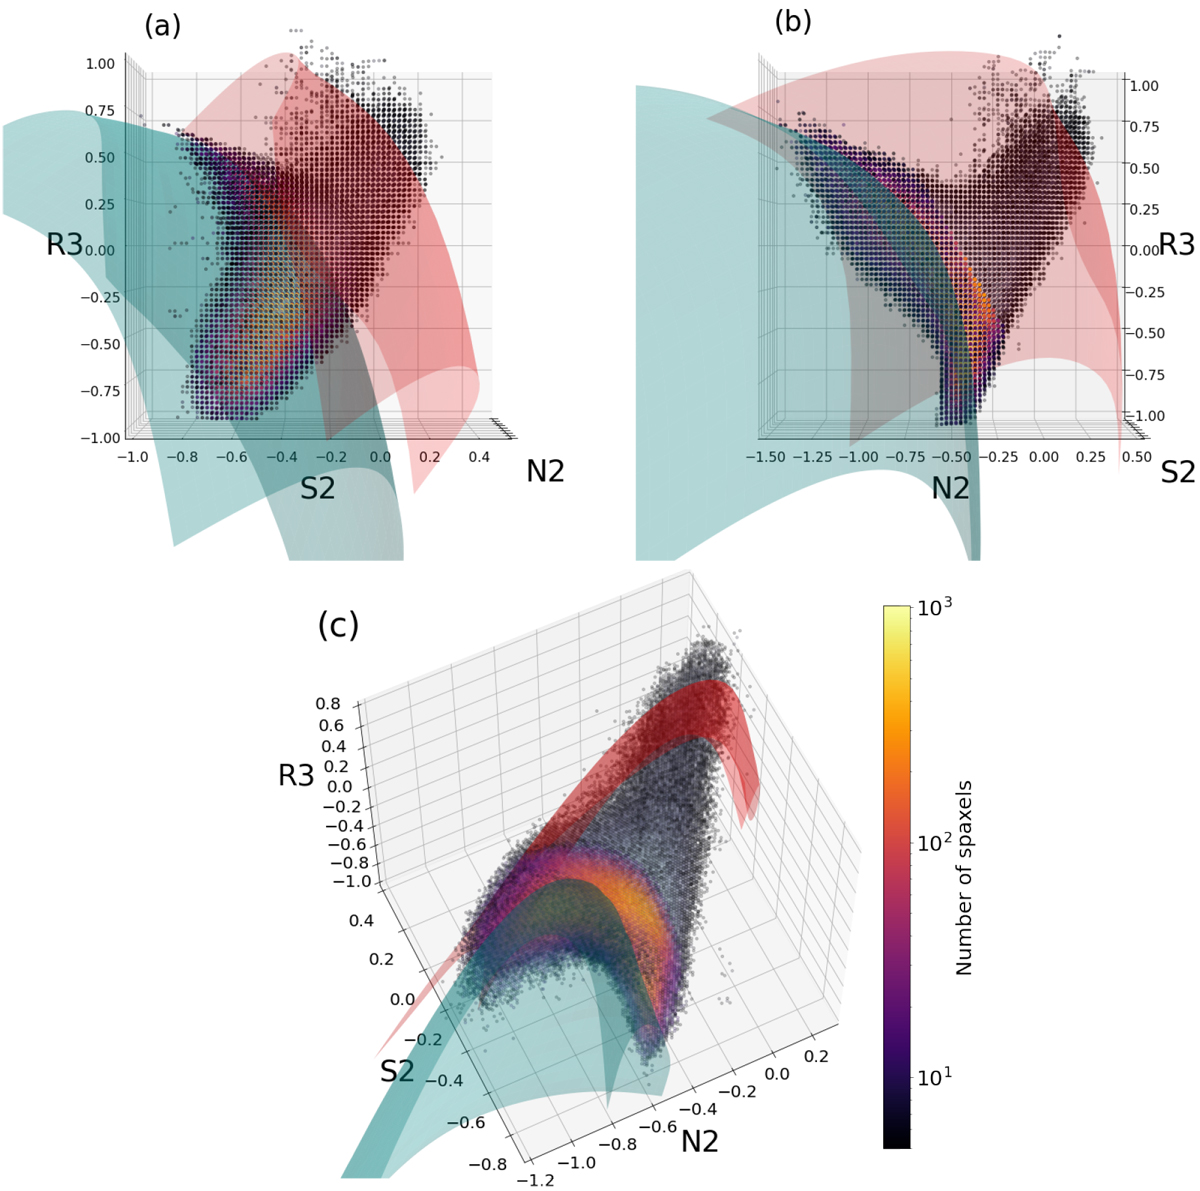
Density distribution of MaNGA MPL-7 spaxels in the 3D space spanned by N2, S2, and R3. Our sample H II region spaxels are colored from yellow to purple, while the rest of the spaxels are colored from white to black. Two photoionization model surfaces are shown. The cyan model and the red model are our fiducial SF model and AGN model, respectively. We show three viewing angles that lead to different 2D projections. Specifically, panel a and panel b correspond to the [S II]- and [N II]- BPT diagrams. Panel c shows that the two model surfaces are separate in 3D and that they are connected by a continuous mixing sequence.
Current usage metrics show cumulative count of Article Views (full-text article views including HTML views, PDF and ePub downloads, according to the available data) and Abstracts Views on Vision4Press platform.
Data correspond to usage on the plateform after 2015. The current usage metrics is available 48-96 hours after online publication and is updated daily on week days.
Initial download of the metrics may take a while.