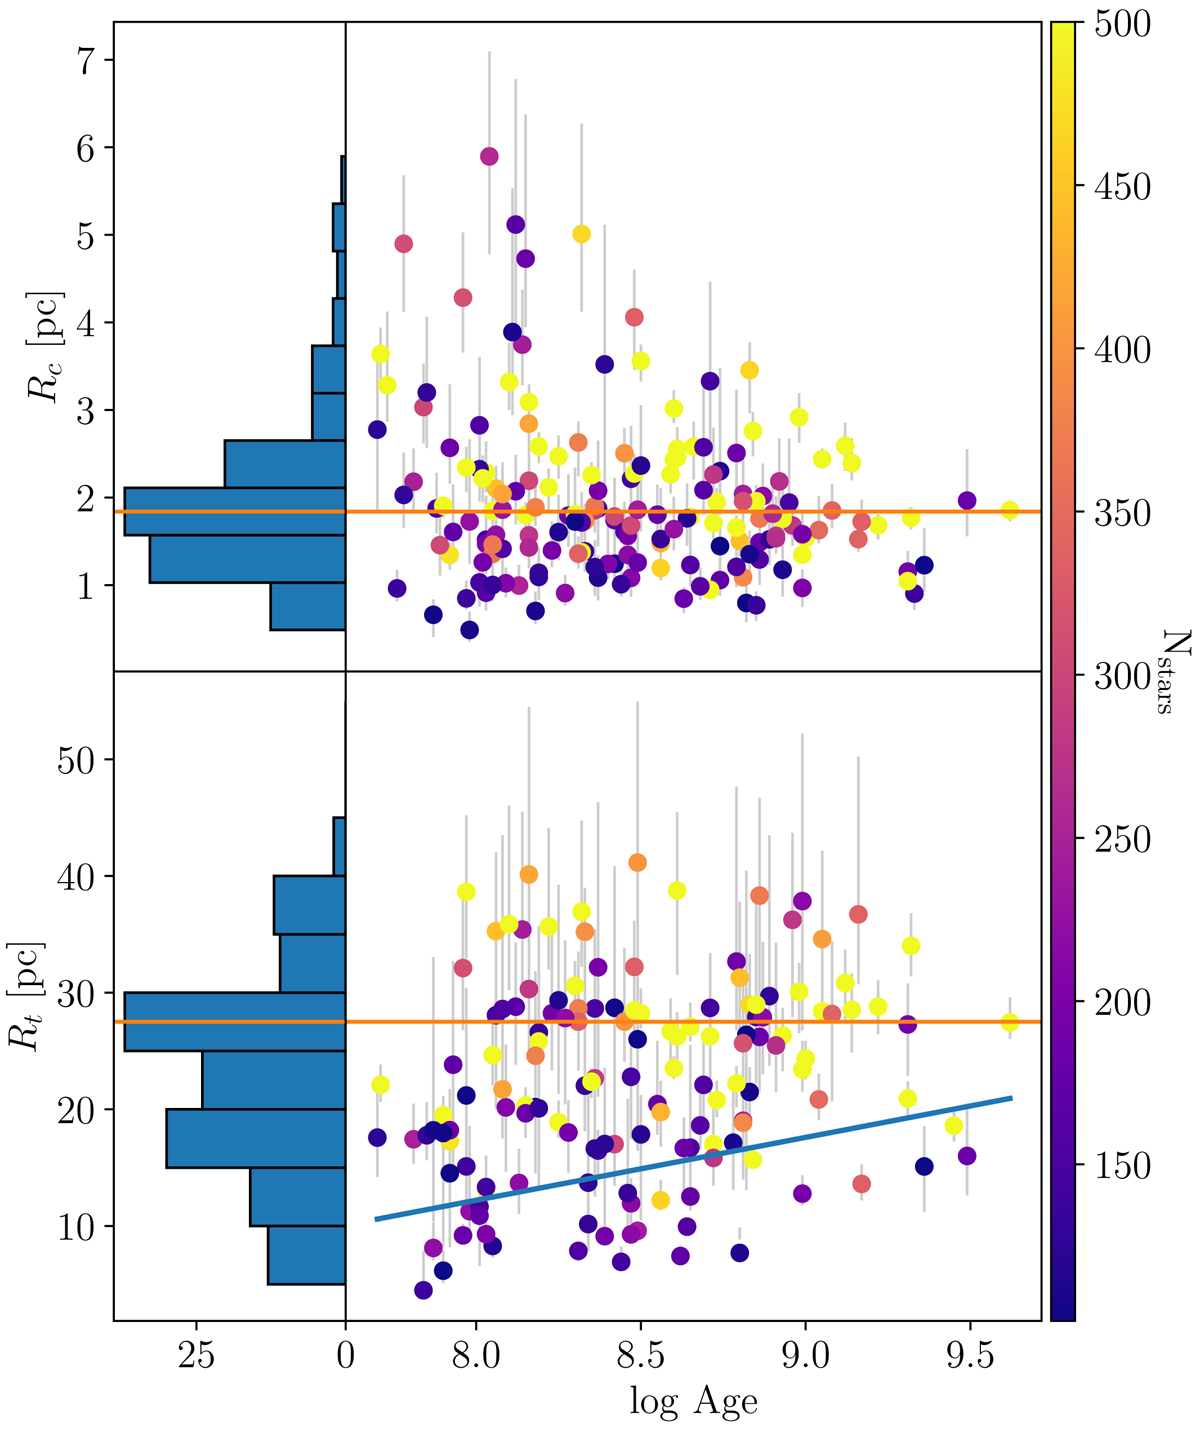
Fig. 6.
Download original image
Fitted core radii Rc (top) and tidal radii Rt (bottom) shown as a function of the logarithm of the cluster ages and their corresponding histograms. The color bar stands for the number of cluster members, and the mode of the distributions is overplotted with the solid orange line. A linear regression of the tidal radii vs age has been fitted with a least-squares method (blue line).
Current usage metrics show cumulative count of Article Views (full-text article views including HTML views, PDF and ePub downloads, according to the available data) and Abstracts Views on Vision4Press platform.
Data correspond to usage on the plateform after 2015. The current usage metrics is available 48-96 hours after online publication and is updated daily on week days.
Initial download of the metrics may take a while.