Fig. 4.
Download original image
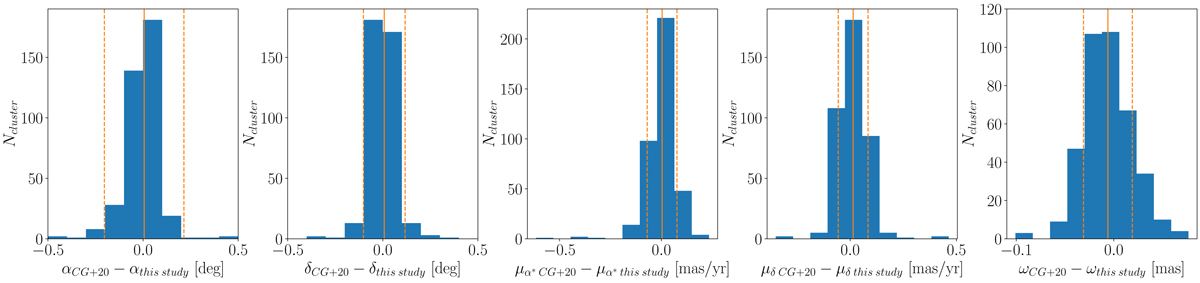
Distribution of the residuals of the mean cluster parameters of CAN+20 and those calculated in this study. The solid orange line represents the mean of the distribution, and the dashed orange lines show the 1σ standard deviation from the mean. For clarity, the offset between the mean positions calculated here and the previously reported mean positions are only shown in the range (−0.5, 0.5) degrees, even though nine and five OCs lie beyond this limit for the right ascension and declination, respectively.
Current usage metrics show cumulative count of Article Views (full-text article views including HTML views, PDF and ePub downloads, according to the available data) and Abstracts Views on Vision4Press platform.
Data correspond to usage on the plateform after 2015. The current usage metrics is available 48-96 hours after online publication and is updated daily on week days.
Initial download of the metrics may take a while.