Fig. 2.
Download original image
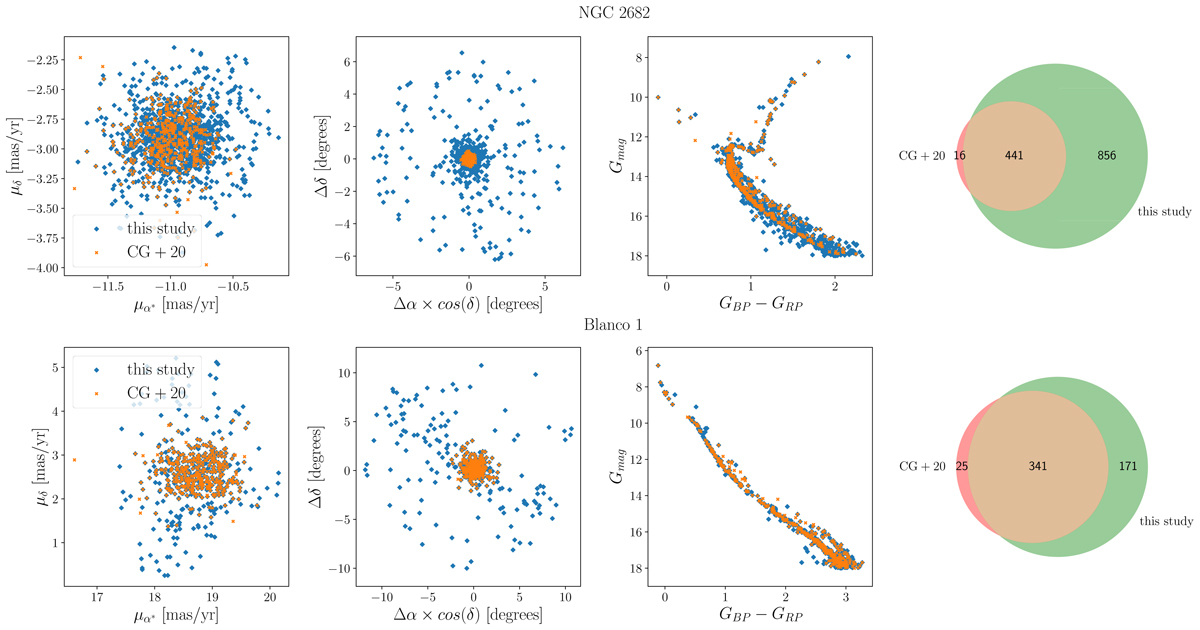
Example of the results of our clustering procedure for NGC 2682 (upper panels) and Blanco 1 (lower panels). For each cluster, the three scatter plots represent (from left to right) a comparison between the members from CAN+20 (in orange) and ours (in blue) in proper motion space, in equatorial coordinate space, and in the color magnitude diagram. Rightmost panel: a Venn diagram for both clusters, in which the number of members in both studies is compared with members from CAN+20 in red, our members in green, and the overlap in orange.
Current usage metrics show cumulative count of Article Views (full-text article views including HTML views, PDF and ePub downloads, according to the available data) and Abstracts Views on Vision4Press platform.
Data correspond to usage on the plateform after 2015. The current usage metrics is available 48-96 hours after online publication and is updated daily on week days.
Initial download of the metrics may take a while.