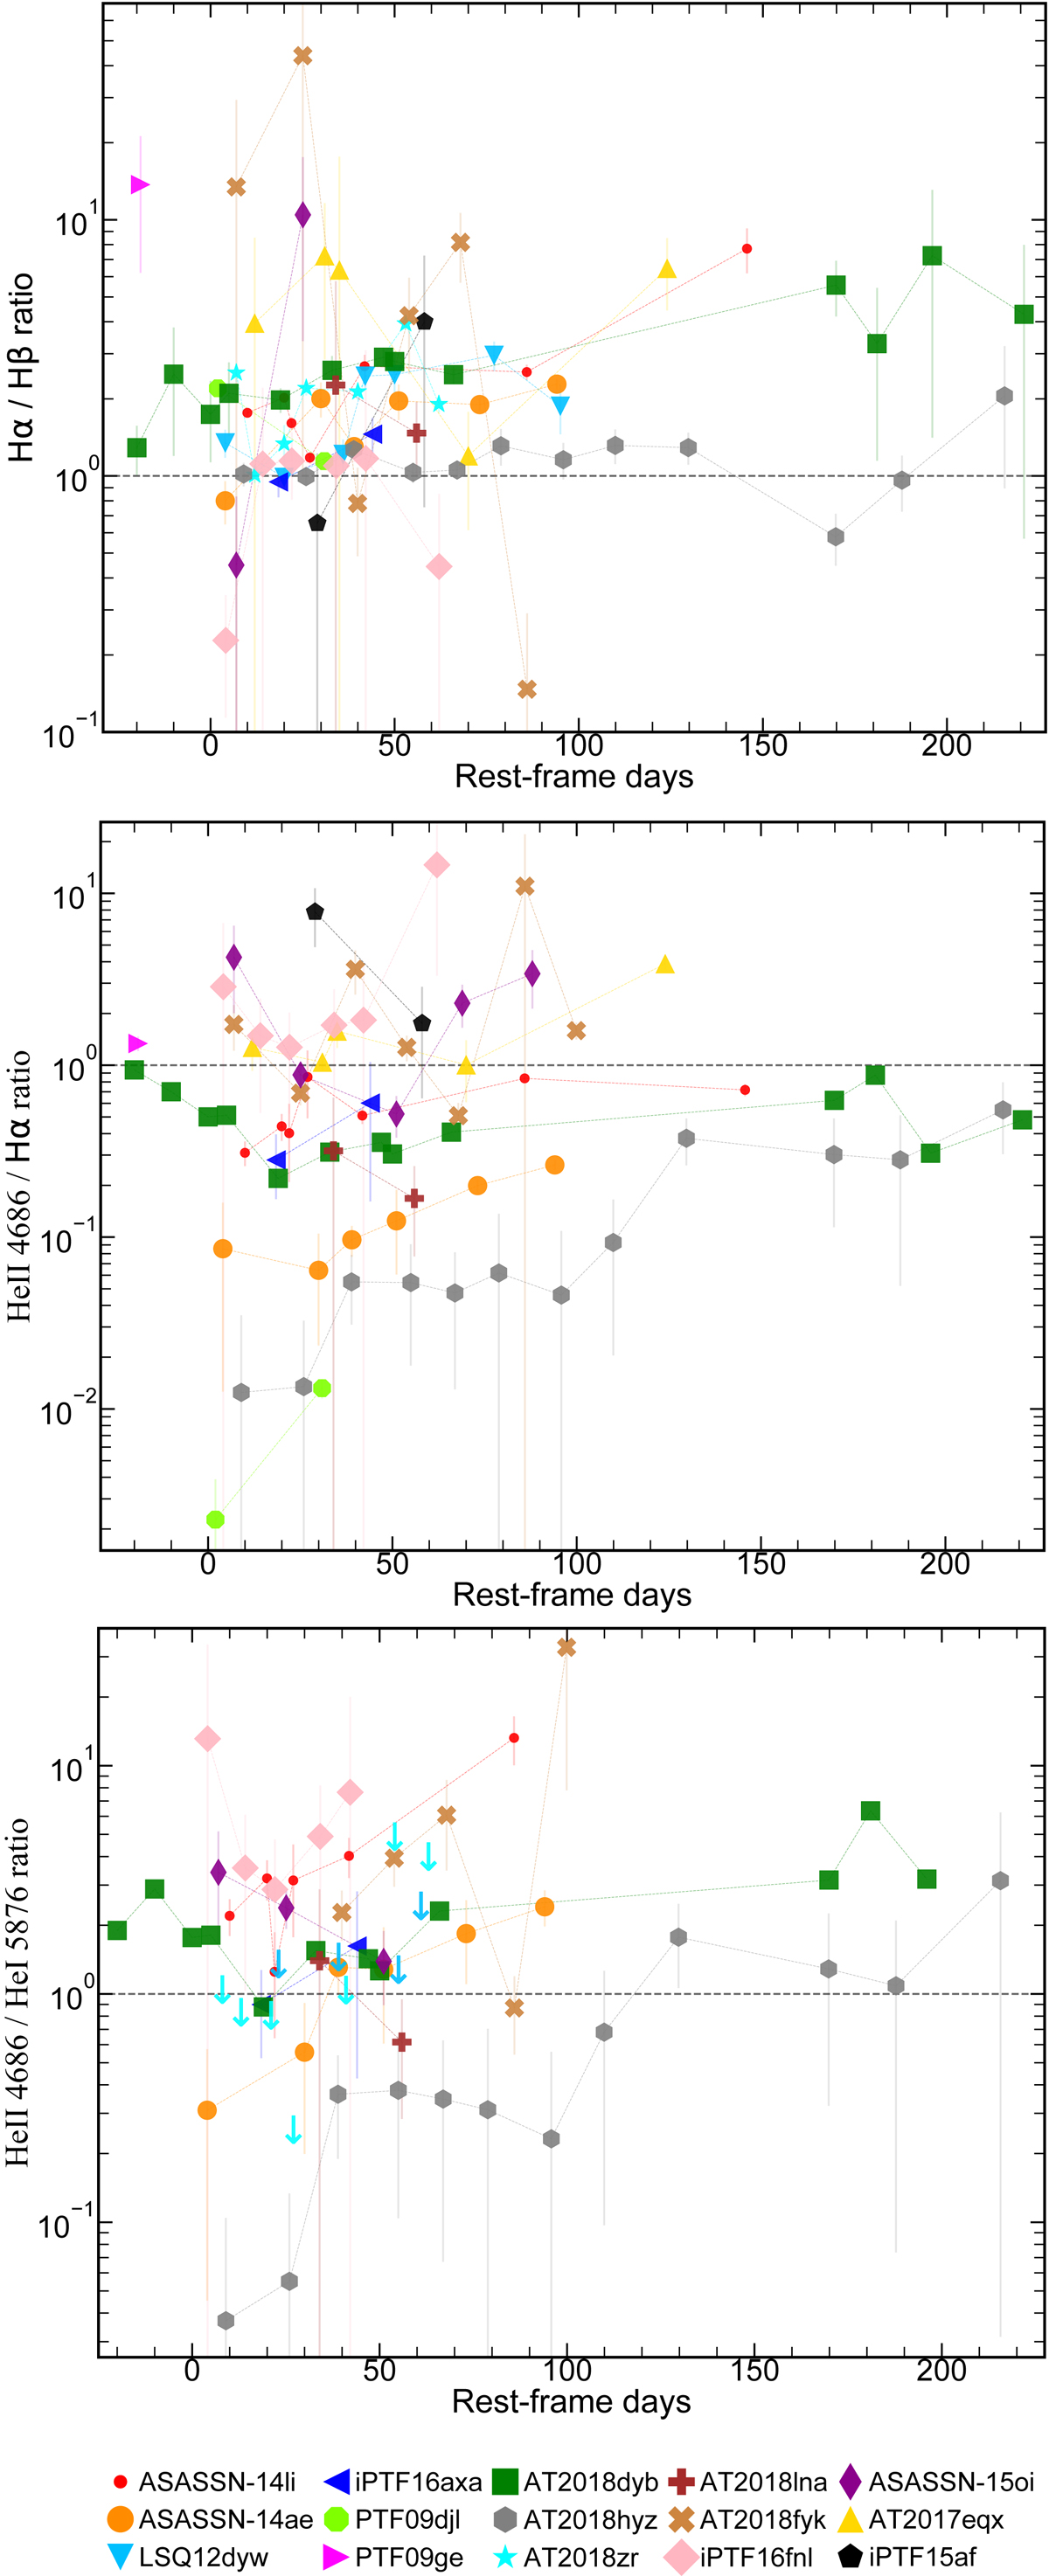
Fig. 9.
Download original image
Evolution of line luminosity ratios with time: Hα/Hβ (top), He II/Hα (middle) and He II/He I (bottom). The vertical axes in all panels are logarithmic. The Hα/Hβ ratio shows a large diversity within the sample and, occasionally, a significant time evolution for individual events. He II seems to be persistent in TDEs as the He II/Hα and He II/He I ratios do not drop with time. AT2018zr and LSQ12dyw do not show He II in their spectra hence we place upper-limits for those in the He II/He I ratio plot. For visual purposes, the large error bars in the He II ratios of AT2018dyb have been removed (see Sect. 5.1.2).
Current usage metrics show cumulative count of Article Views (full-text article views including HTML views, PDF and ePub downloads, according to the available data) and Abstracts Views on Vision4Press platform.
Data correspond to usage on the plateform after 2015. The current usage metrics is available 48-96 hours after online publication and is updated daily on week days.
Initial download of the metrics may take a while.