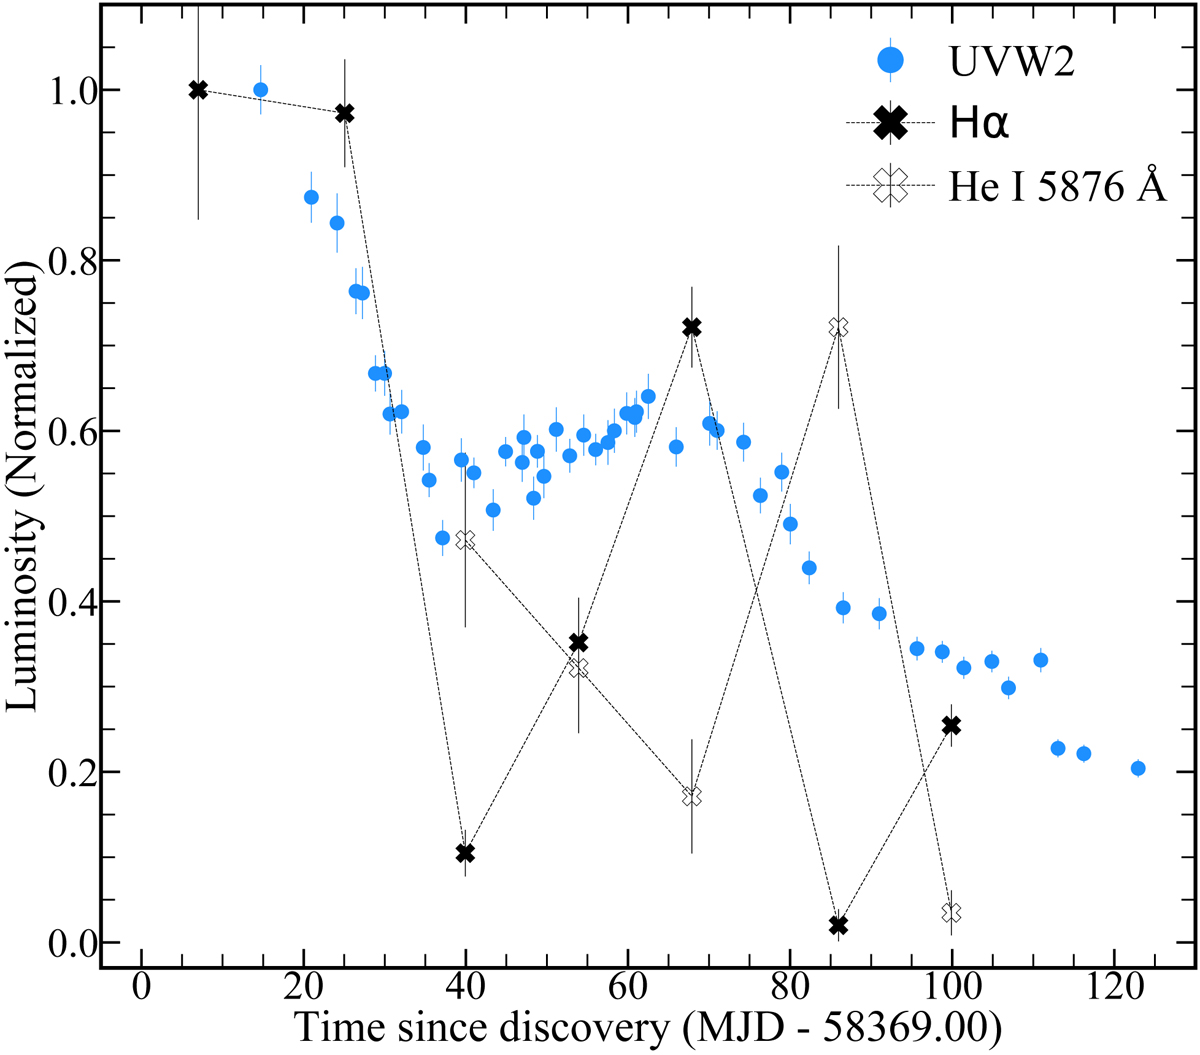
Fig. 8.
Download original image
Evolution of the Hα and He I 5876 Å line luminosities of TDE AT2018fyk plotted with black and empty X-marks respectively and Swift UVW2 band light curve (Wevers et al. 2019a) plotted in blue circles. All luminosity curves are normalized to one. The line luminosities respond to variations of the light curve with a small lag for Hα and a larger one for He I.
Current usage metrics show cumulative count of Article Views (full-text article views including HTML views, PDF and ePub downloads, according to the available data) and Abstracts Views on Vision4Press platform.
Data correspond to usage on the plateform after 2015. The current usage metrics is available 48-96 hours after online publication and is updated daily on week days.
Initial download of the metrics may take a while.