Fig. 7.
Download original image
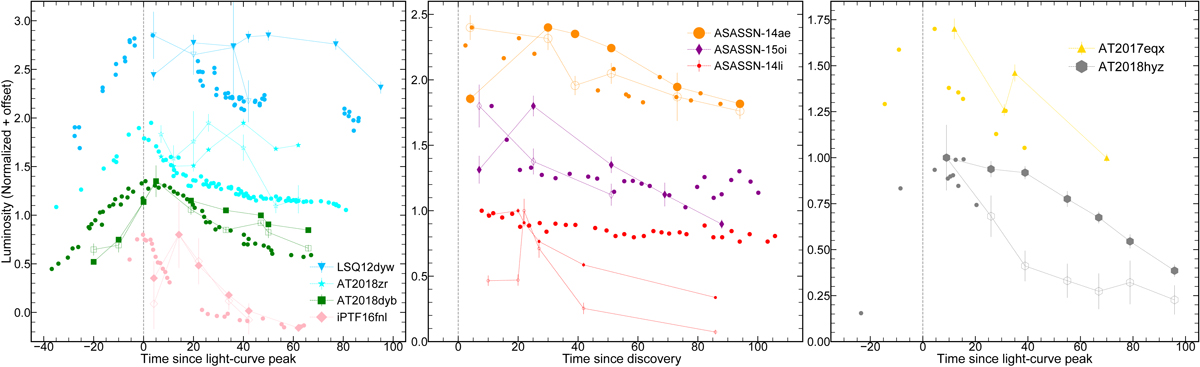
Comparison of the Hα (filled markers), He I 5876 Å (empty markers) and continuum light curves for the TDEs in our sample that have a “determinable” time lag between the Hα and the optical light curve luminosities (i.e., events with ≤ two spectra are not plotted). Left panel: events that were observed pre-peak and the lag between the continuum and Hα luminosities are obvious. The dashed vertical line denotes the time of peak (see Table 1). Middle panel: events discovered post-peak but for which the Hα luminosity shows a delayed peak and for which a lower-limit can be placed on the lag. The dashed vertical line denotes the time of discovery of these TDEs as reported in their discovery paper. The plotted light curves are in the SwiftV band. Right panel: events for which the existence of a time lag cannot be claimed. The dashed vertical line denotes the time of peak.
Current usage metrics show cumulative count of Article Views (full-text article views including HTML views, PDF and ePub downloads, according to the available data) and Abstracts Views on Vision4Press platform.
Data correspond to usage on the plateform after 2015. The current usage metrics is available 48-96 hours after online publication and is updated daily on week days.
Initial download of the metrics may take a while.