Free Access
Fig. 6.
Download original image
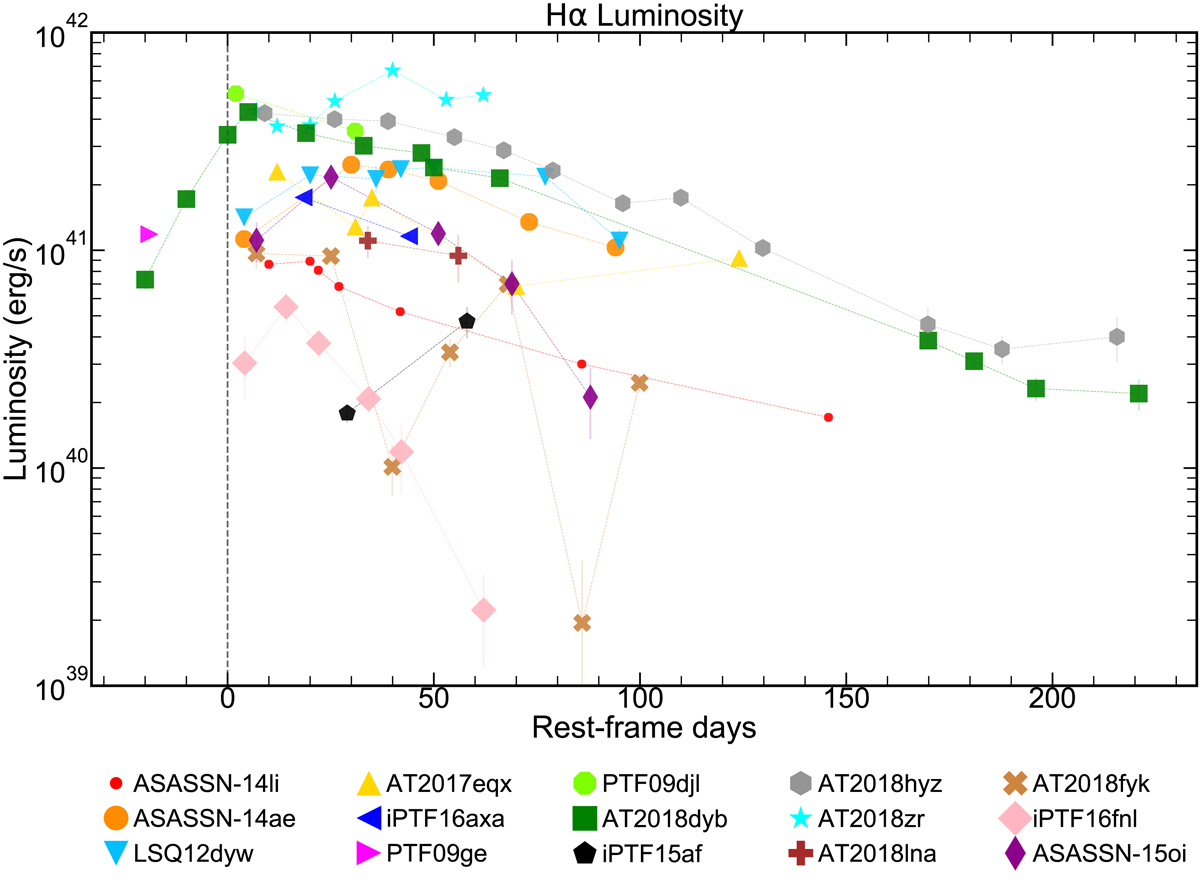
Evolution of the Hα line luminosity for all the TDEs of our sample. The dashed vertical line denotes the time of peak or discovery of each TDE. A number of TDEs show a lag between their Hα luminosity peak and the time of the light curve peak.
Current usage metrics show cumulative count of Article Views (full-text article views including HTML views, PDF and ePub downloads, according to the available data) and Abstracts Views on Vision4Press platform.
Data correspond to usage on the plateform after 2015. The current usage metrics is available 48-96 hours after online publication and is updated daily on week days.
Initial download of the metrics may take a while.