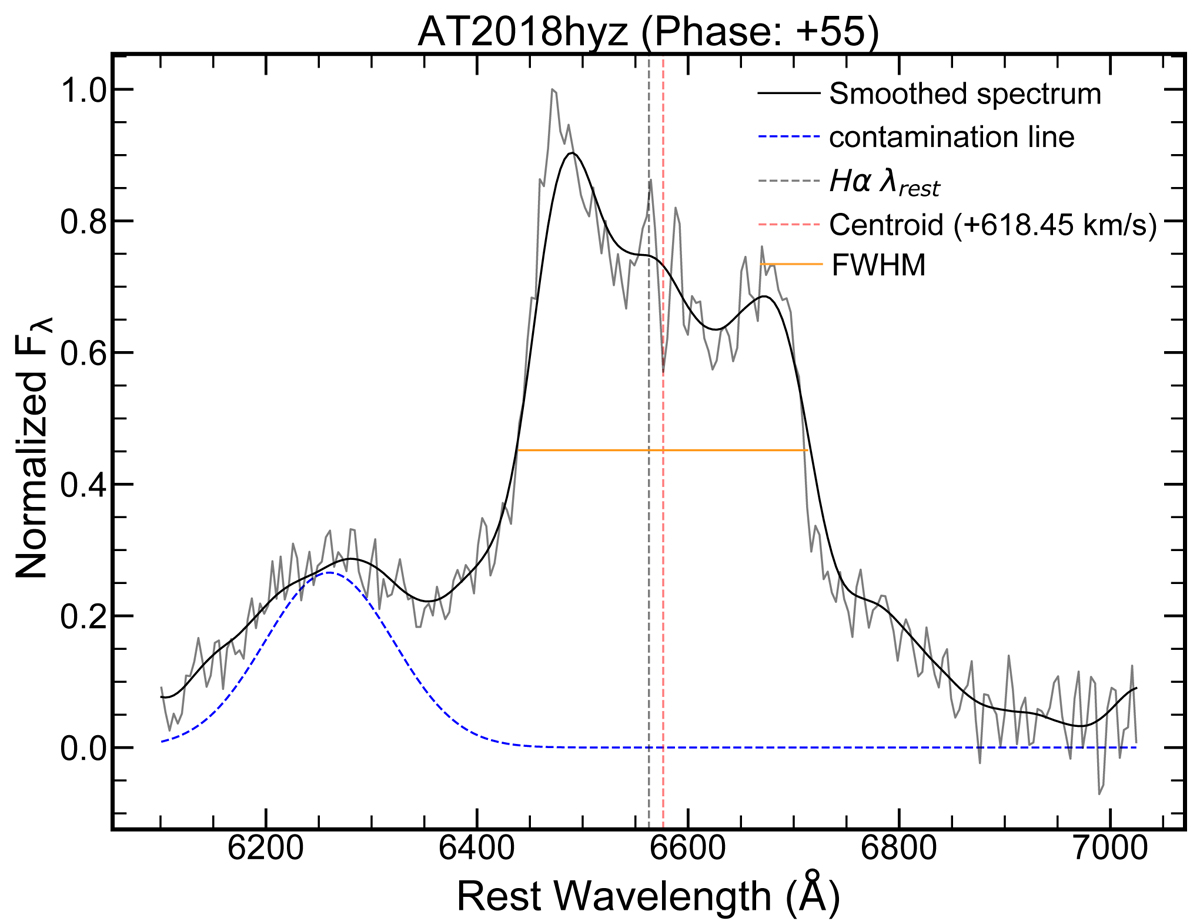
Fig. 4.
Download original image
Demonstration of our direct integration method for profiles where a Gaussian or Lorentzian fit was not possible. This is the Hα line of TDE AT2018hyz. We employed direct integration to measure the flux of the whole blend and determine the line width and velocity offset (see text for details). A Gaussian profile was fit to the line on the blue side of Hα in order to subtract it from the total underlying flux.
Current usage metrics show cumulative count of Article Views (full-text article views including HTML views, PDF and ePub downloads, according to the available data) and Abstracts Views on Vision4Press platform.
Data correspond to usage on the plateform after 2015. The current usage metrics is available 48-96 hours after online publication and is updated daily on week days.
Initial download of the metrics may take a while.