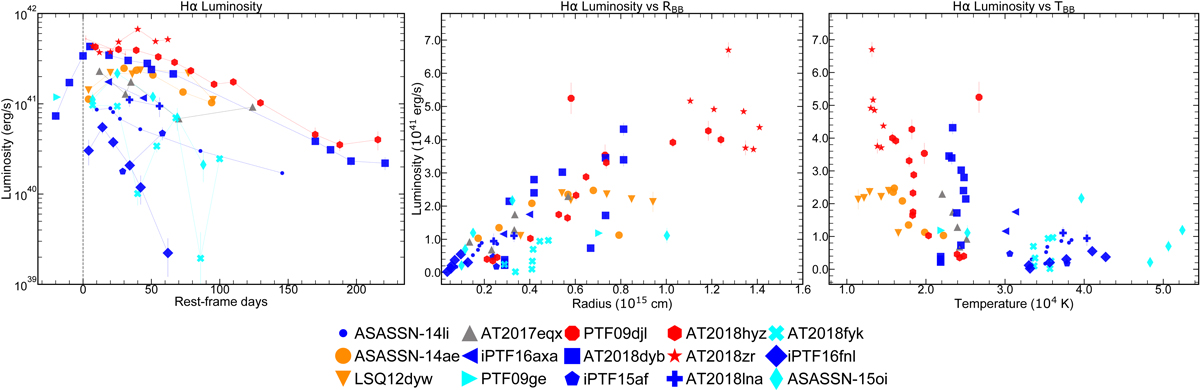
Fig. 20.
Download original image
Evolution of the Hα line luminosity as a function of time (left panel), RBB (middle panel) and TBB (right panel). The plot is color-coded as follows: The H+He Iron-rich (with potentially O III lines) events are plotted with cyan, the H+He Nitrogen Bowen events are plotted with blue, the double-peaked H events are plotted with red and the plain H events are plotted in orange. AT2017eqx does not meet the criteria of any of these four subcategories and is plotted in gray. The last two H subcategories show very high Hα luminosity compared to the rest as well as low blackbody temperatures. This subcategory grouping is summarized in Table 5.
Current usage metrics show cumulative count of Article Views (full-text article views including HTML views, PDF and ePub downloads, according to the available data) and Abstracts Views on Vision4Press platform.
Data correspond to usage on the plateform after 2015. The current usage metrics is available 48-96 hours after online publication and is updated daily on week days.
Initial download of the metrics may take a while.