Free Access
Fig. 2.
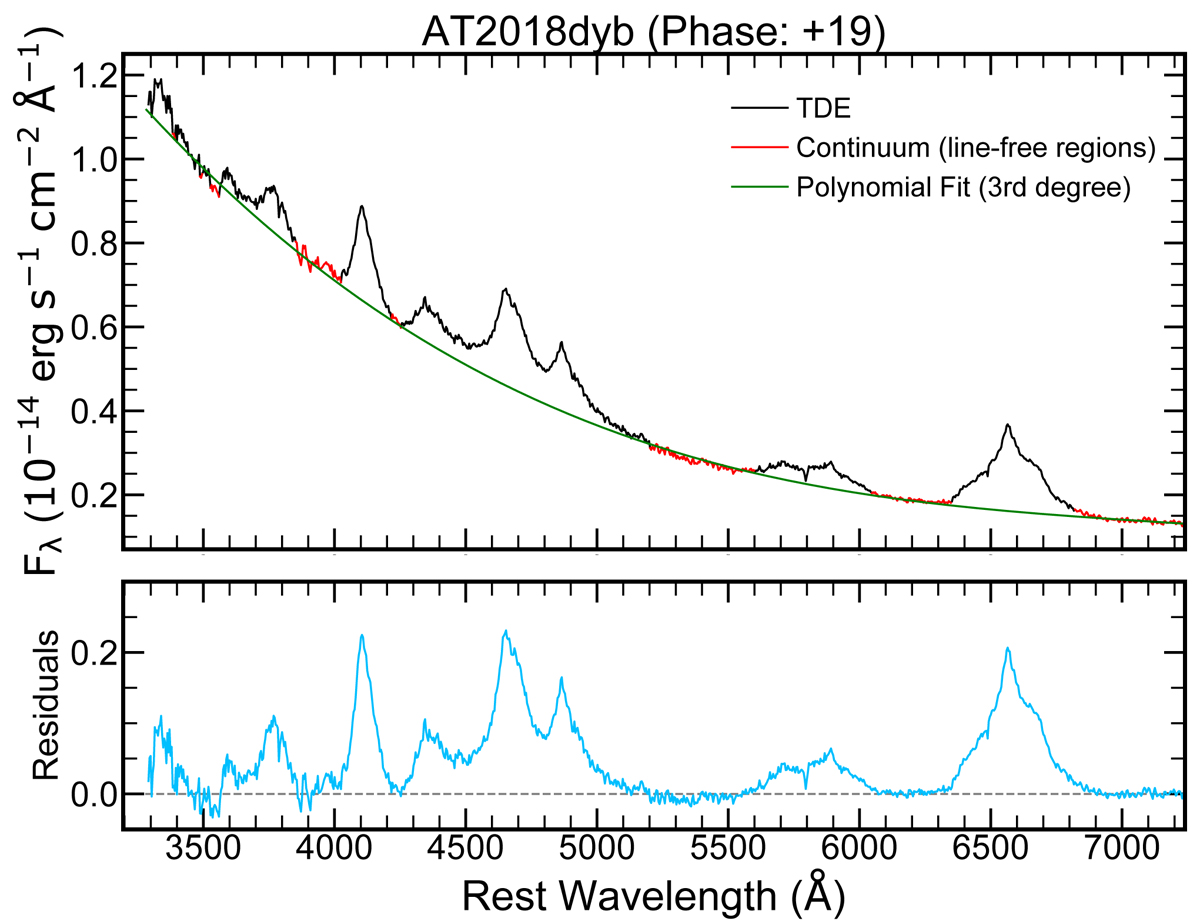
Download original image
Example continuum removal from the spectrum of TDE AT2018dyb at +18 days (black). The line-free regions are marked with red and the polynomial fit to the continuum with green. Lower panel: residuals, i.e., the pure emission line spectrum of the TDE (blue).
Current usage metrics show cumulative count of Article Views (full-text article views including HTML views, PDF and ePub downloads, according to the available data) and Abstracts Views on Vision4Press platform.
Data correspond to usage on the plateform after 2015. The current usage metrics is available 48-96 hours after online publication and is updated daily on week days.
Initial download of the metrics may take a while.