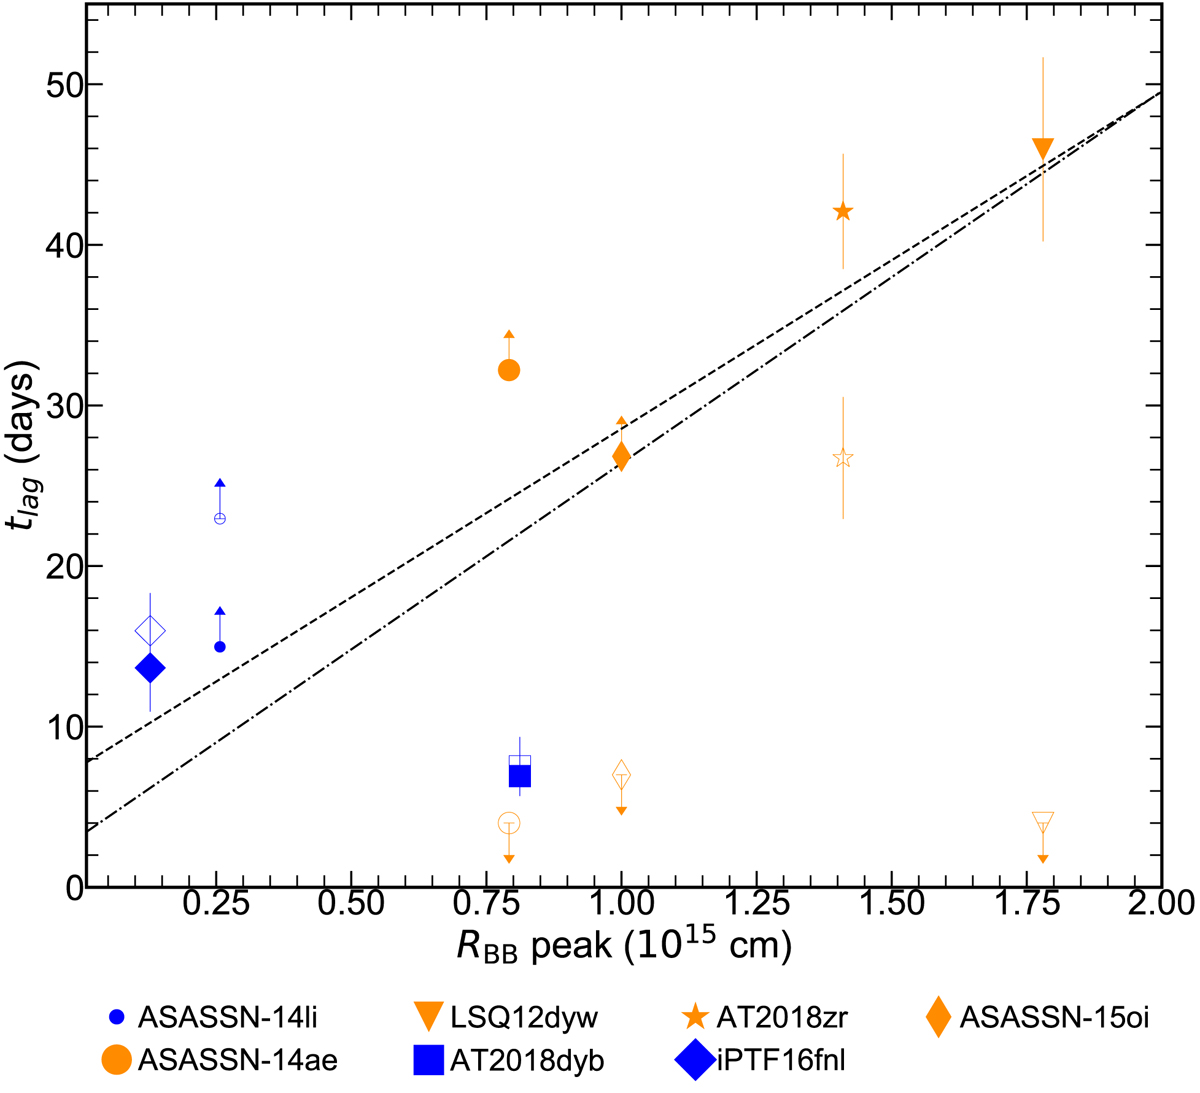
Fig. 18.
Download original image
Hα (filled markers) and He I 5876 Å (empty markers) luminosity time lag (see Table 2) against the blackbody radius at peak. The graph is color coded for Bowen N III TDEs (blue) and not Bowen (orange). The dashed line is a linear regression fit for the Hα lag only while the dot-dashed is the same fit without fitting the three lower-limits. N III Bowen TDEs show lower Hα lag values than the rest of the TDEs in the sample.
Current usage metrics show cumulative count of Article Views (full-text article views including HTML views, PDF and ePub downloads, according to the available data) and Abstracts Views on Vision4Press platform.
Data correspond to usage on the plateform after 2015. The current usage metrics is available 48-96 hours after online publication and is updated daily on week days.
Initial download of the metrics may take a while.