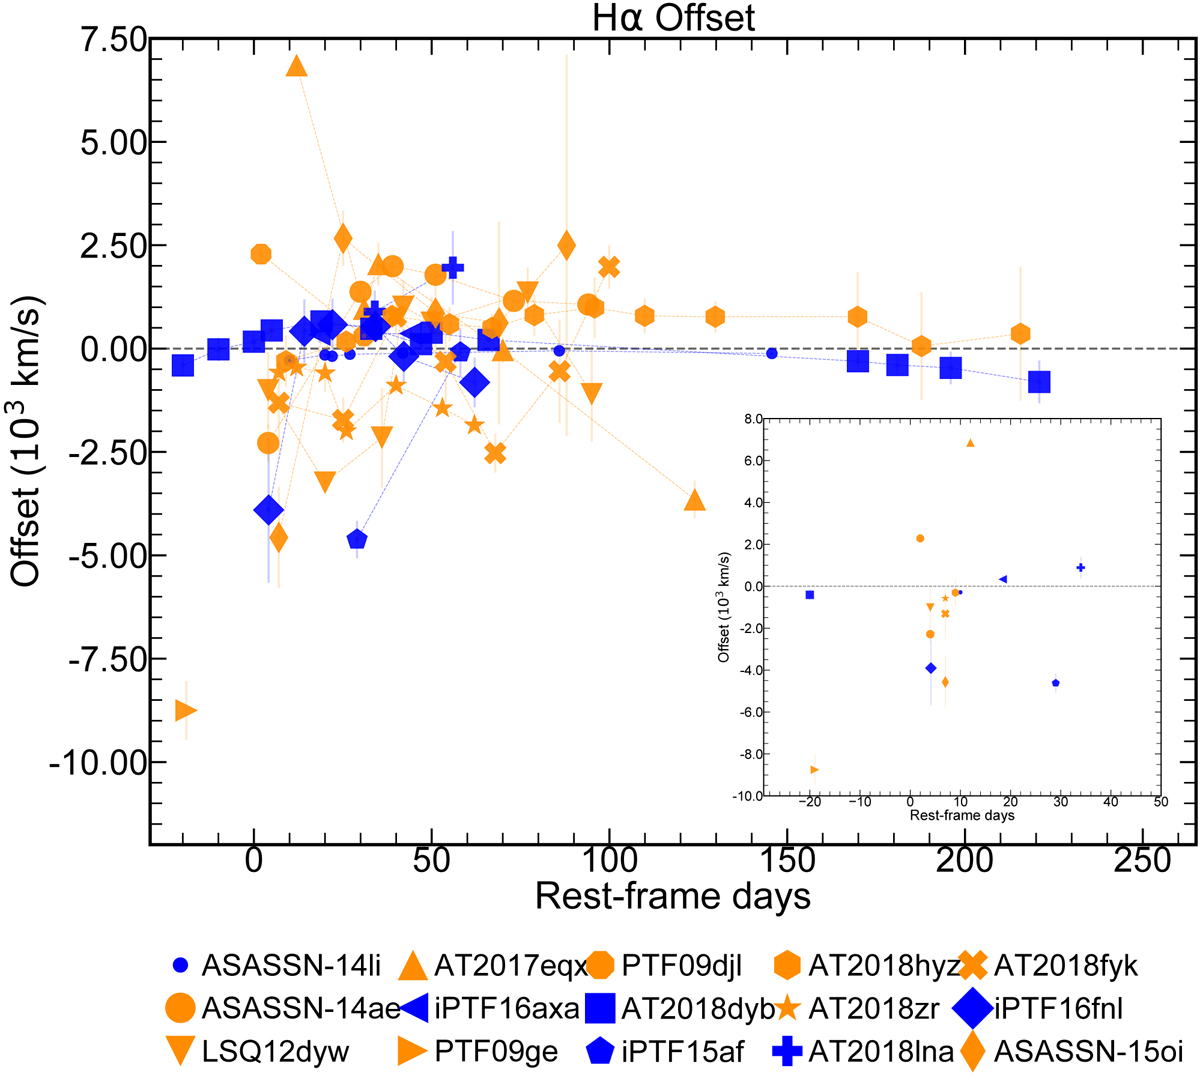
Fig. 16.
Download original image
Evolution of the Hα velocity offset with time. The graph is color coded for Bowen N III TDEs (blue) and not Bowen (orange). The embedded panel contains the Hα offset of the first available epoch of each TDE. The Hα line at the first epoch for the majority of the TDEs is blueshifted. The N III Bowen TDEs show lower offsets compared to the rest of the TDEs which show more extreme values.
Current usage metrics show cumulative count of Article Views (full-text article views including HTML views, PDF and ePub downloads, according to the available data) and Abstracts Views on Vision4Press platform.
Data correspond to usage on the plateform after 2015. The current usage metrics is available 48-96 hours after online publication and is updated daily on week days.
Initial download of the metrics may take a while.