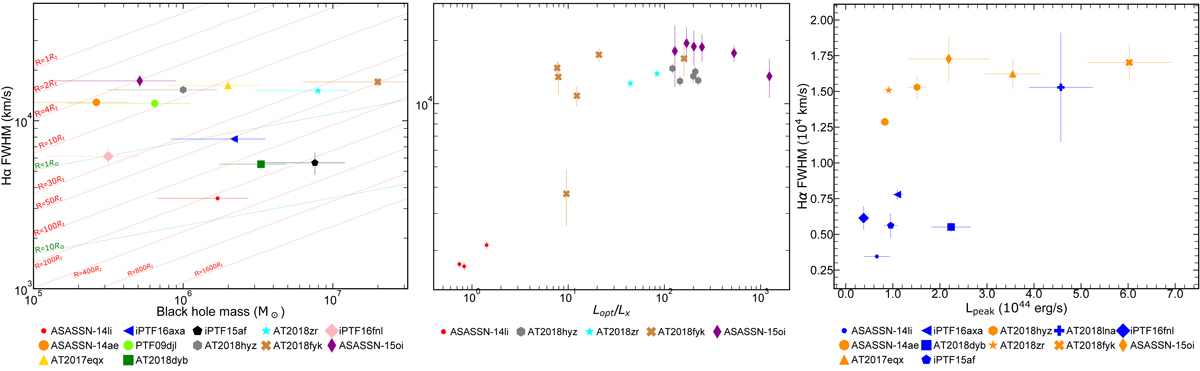
Fig. 15.
Download original image
Left panel: FWHM of Hα around 30 days after peak/discovery against the black hole mass of each respective TDE. The dashed red lines represent the expected keplerian velocity correlations for bound material at different radii (assuming a sun-like star). The solid green lines are the velocities for the outflowing material assuming Rp = Rt (pericenter and tidal radii respectively) for a sun-like star (1 R*) or red giant (10 R*) (Arcavi et al. 2014). No evidence for correlation is found between the line widths and the BH masses. Middle panel: FWHM of Hα against the Lopt/LX of X-ray TDEs (taken from Wevers et al. 2019a) at the epochs for which we have spectra. The only TDE that exhibits strong X-ray emission during these epochs is ASASSN-14li and it is the one with the lowest FWHM. Right panel: FWHM of Hα around 30 days after peak/discovery (same FWHM as left panel) against the peak bolometric optical/UV luminosities of each TDE taken from Hinkle et al. (2020). The graph is color coded for Bowen N III TDEs (blue) and not Bowen (orange). Low FWHM TDEs (N III Bowen TDEs) seem to have low Lpeak values.
Current usage metrics show cumulative count of Article Views (full-text article views including HTML views, PDF and ePub downloads, according to the available data) and Abstracts Views on Vision4Press platform.
Data correspond to usage on the plateform after 2015. The current usage metrics is available 48-96 hours after online publication and is updated daily on week days.
Initial download of the metrics may take a while.