Free Access
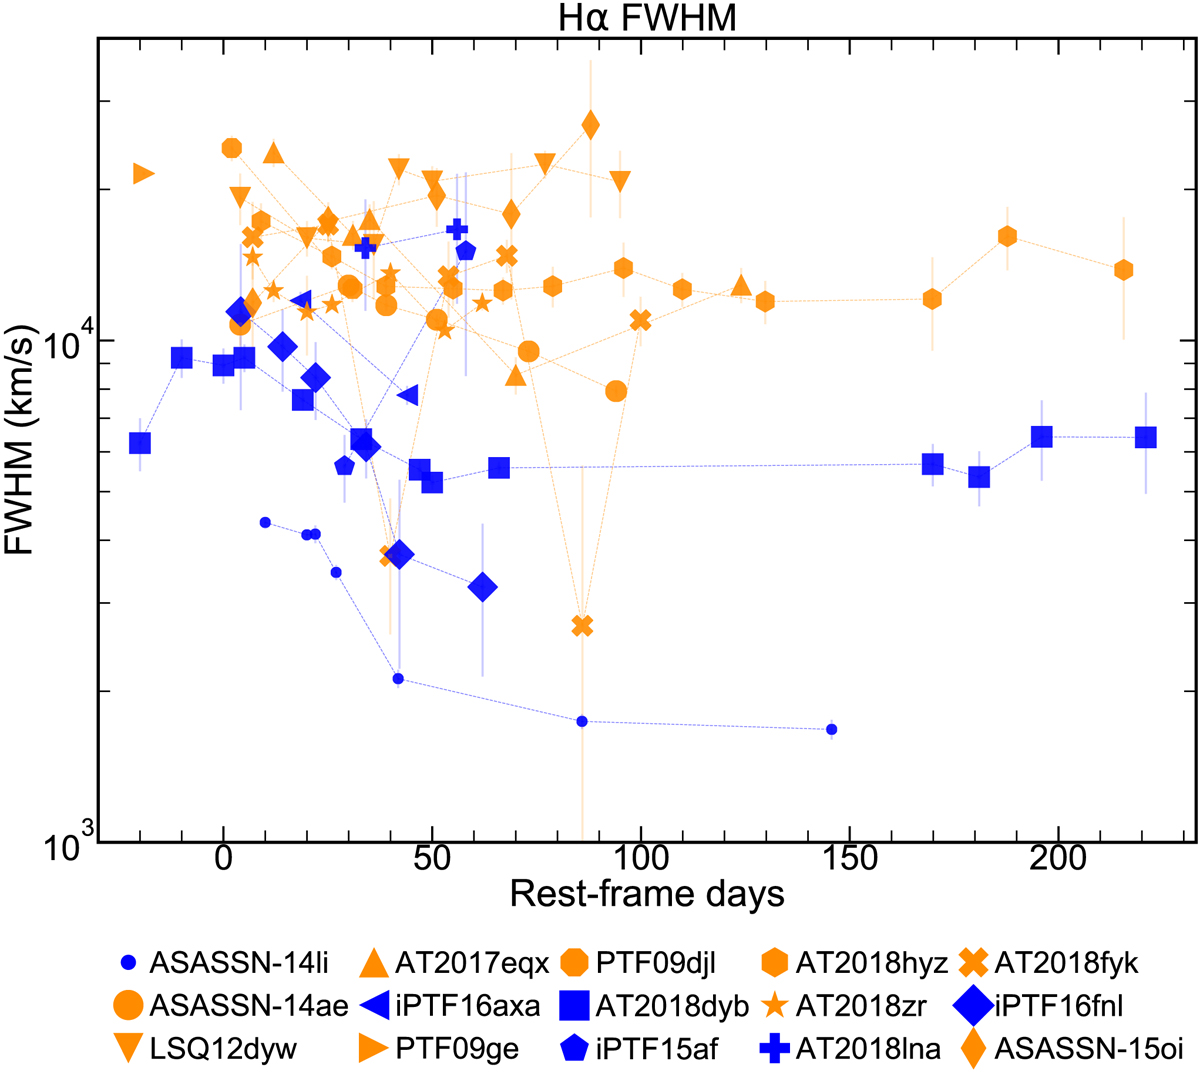
Fig. 14.
Download original image
Evolution of the Hα FWHM with time. The graph is color coded for Bowen N III TDEs (blue) and not Bowen (orange). The former seem to consistently have broader line widths than the latter.
Current usage metrics show cumulative count of Article Views (full-text article views including HTML views, PDF and ePub downloads, according to the available data) and Abstracts Views on Vision4Press platform.
Data correspond to usage on the plateform after 2015. The current usage metrics is available 48-96 hours after online publication and is updated daily on week days.
Initial download of the metrics may take a while.