Fig. 11.
Download original image
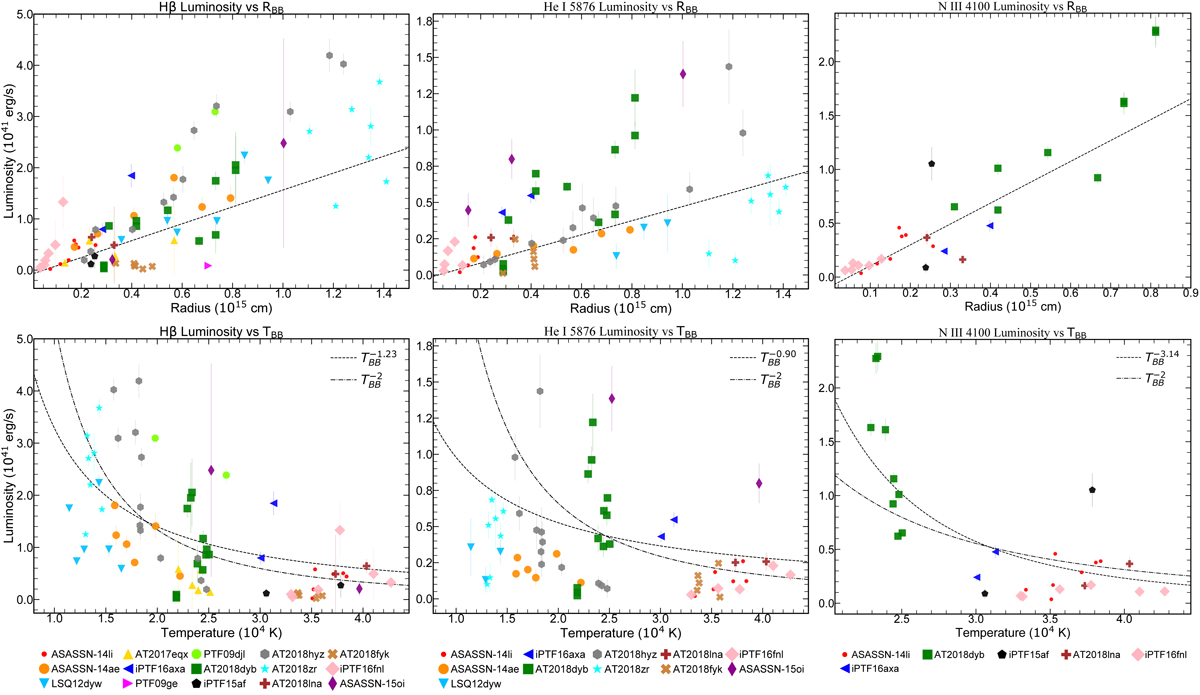
Hβ (left panels), He I 5876 Å (middle panels) and N III 4100 Å (right panels) line luminosities as a function of RBB (upper panels) and TBB (lower panels). The dashed lines are the best fits for the data; linear for RBB and inverse power-law for TBB. The dotted-dashed line in the bottom panels is an inverse power-law fit with the exponent fixed at 2.
Current usage metrics show cumulative count of Article Views (full-text article views including HTML views, PDF and ePub downloads, according to the available data) and Abstracts Views on Vision4Press platform.
Data correspond to usage on the plateform after 2015. The current usage metrics is available 48-96 hours after online publication and is updated daily on week days.
Initial download of the metrics may take a while.