Fig. 1.
Download original image
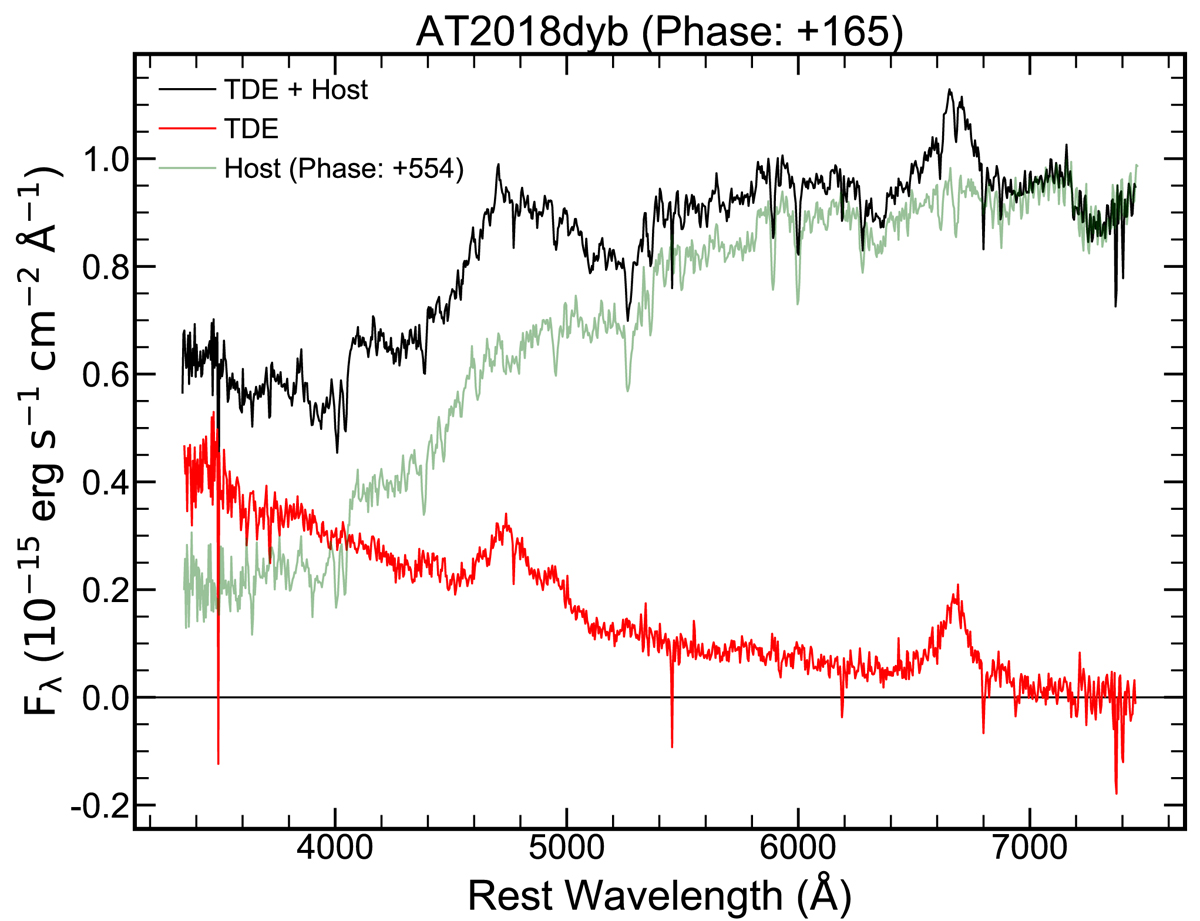
Example host subtraction using the spectrum of TDE AT2018dyb (black) at 165 days post peak (+165 days) and the host galaxy spectrum, obtained at +554 days (green). Despite the significant host contamination, the resulting TDE spectrum (red) is of high quality, allowing for an accurate study of the emission lines even at late stages of the TDE evolution.
Current usage metrics show cumulative count of Article Views (full-text article views including HTML views, PDF and ePub downloads, according to the available data) and Abstracts Views on Vision4Press platform.
Data correspond to usage on the plateform after 2015. The current usage metrics is available 48-96 hours after online publication and is updated daily on week days.
Initial download of the metrics may take a while.