Free Access
Fig. A.3.
Download original image
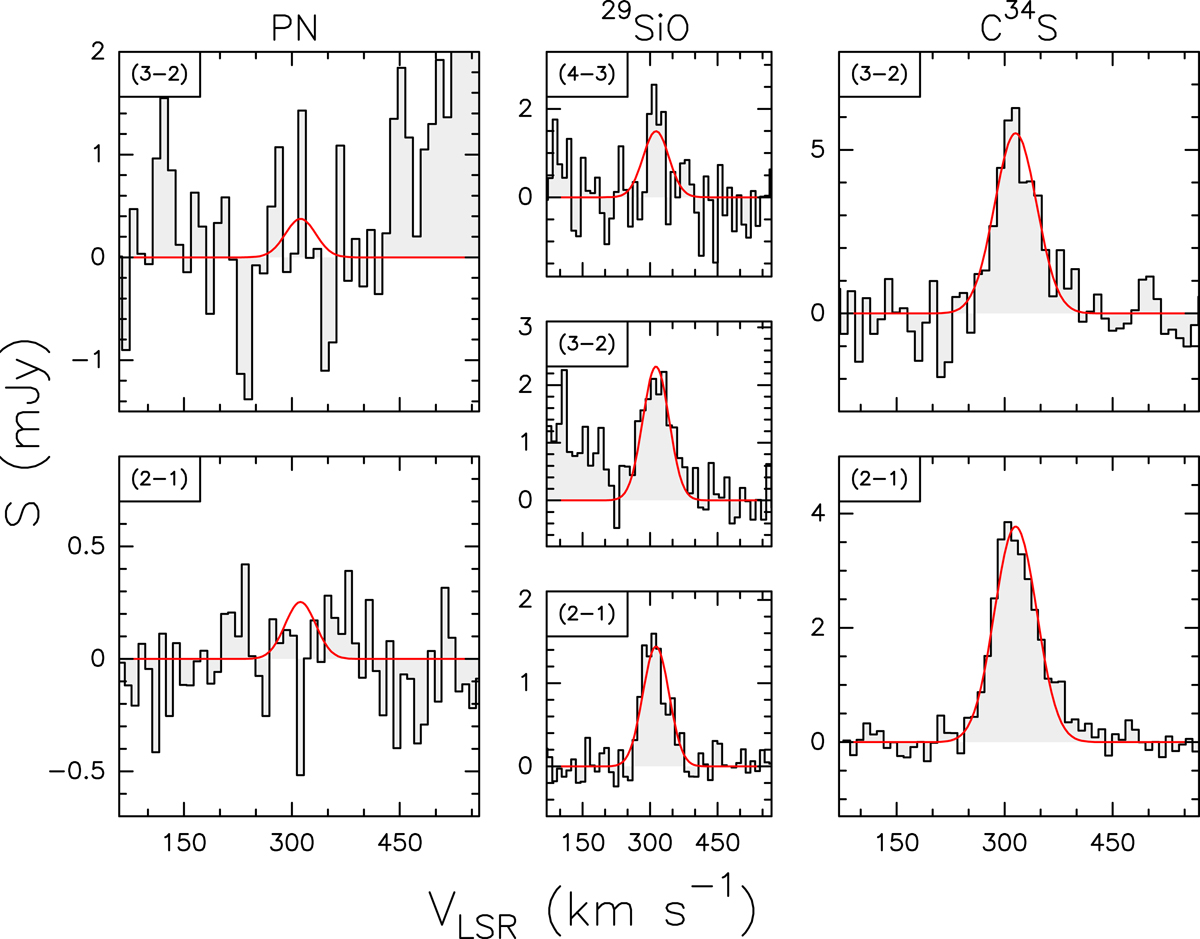
Spectra of PN, 29SiO, and C34S towards GMC 1 are shown with grey histograms. The transition is indicated in the upper left of each panel. The red lines indicate the LTE best fits except for PN, for which the red line indicates an upper limit.
Current usage metrics show cumulative count of Article Views (full-text article views including HTML views, PDF and ePub downloads, according to the available data) and Abstracts Views on Vision4Press platform.
Data correspond to usage on the plateform after 2015. The current usage metrics is available 48-96 hours after online publication and is updated daily on week days.
Initial download of the metrics may take a while.