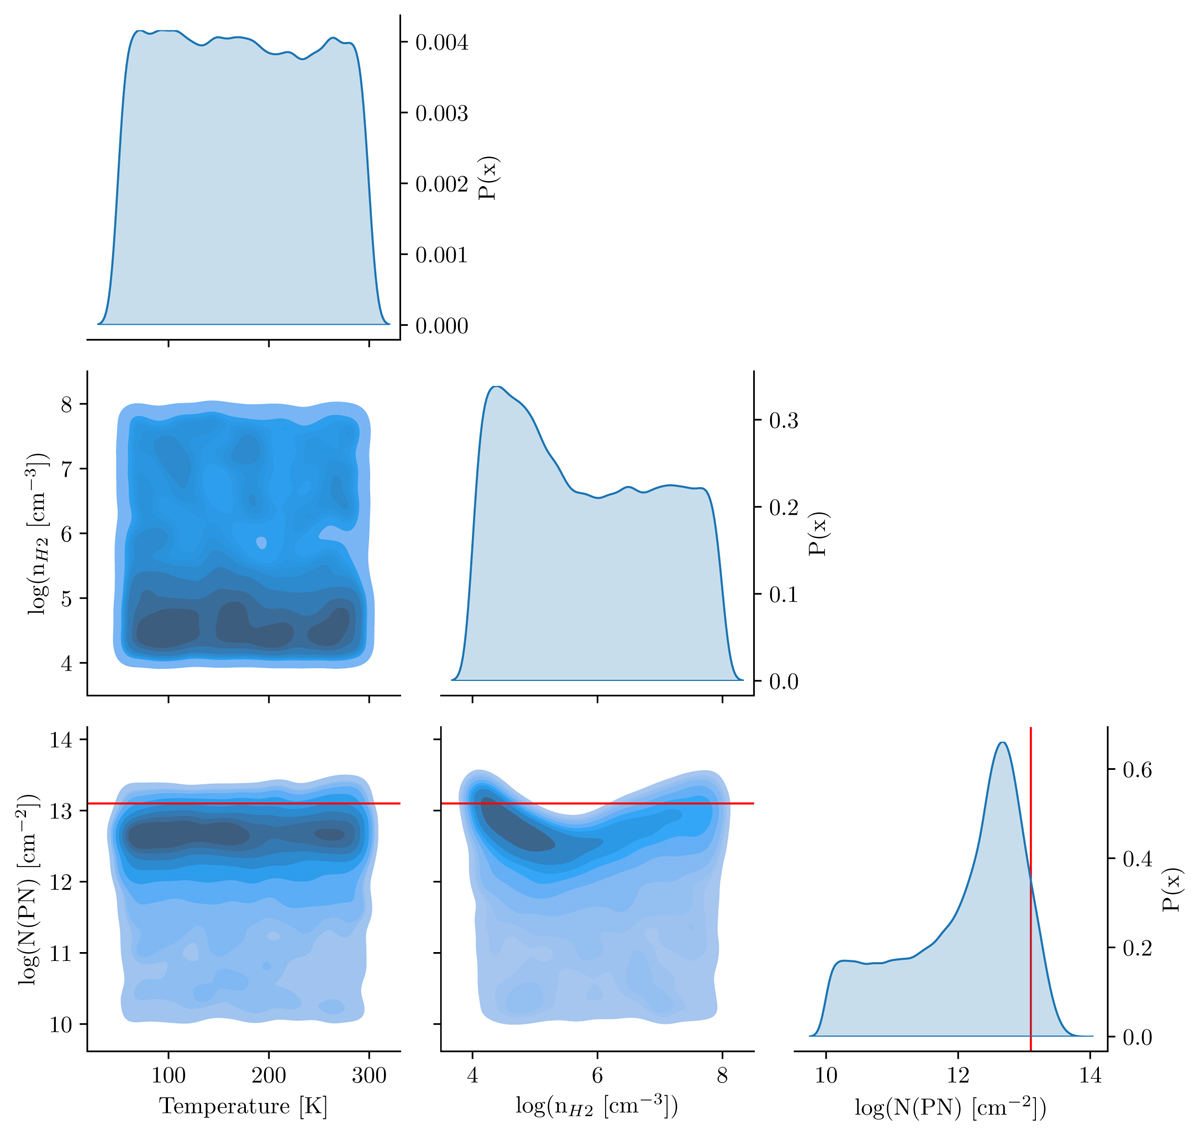
Fig. 3.
Download original image
Marginalised and joint posterior distributions from the MCMC sampling. The 1D distributions show the probability a parameter takes a given value, marginalised over all possible combinations of the other parameters. The 2D distributions are darker where a parameter combination is more likely. Column density, volume density and probability scales are logarithmic. The red lines indicate the value of the PN column density obtained with the LTE analysis.
Current usage metrics show cumulative count of Article Views (full-text article views including HTML views, PDF and ePub downloads, according to the available data) and Abstracts Views on Vision4Press platform.
Data correspond to usage on the plateform after 2015. The current usage metrics is available 48-96 hours after online publication and is updated daily on week days.
Initial download of the metrics may take a while.