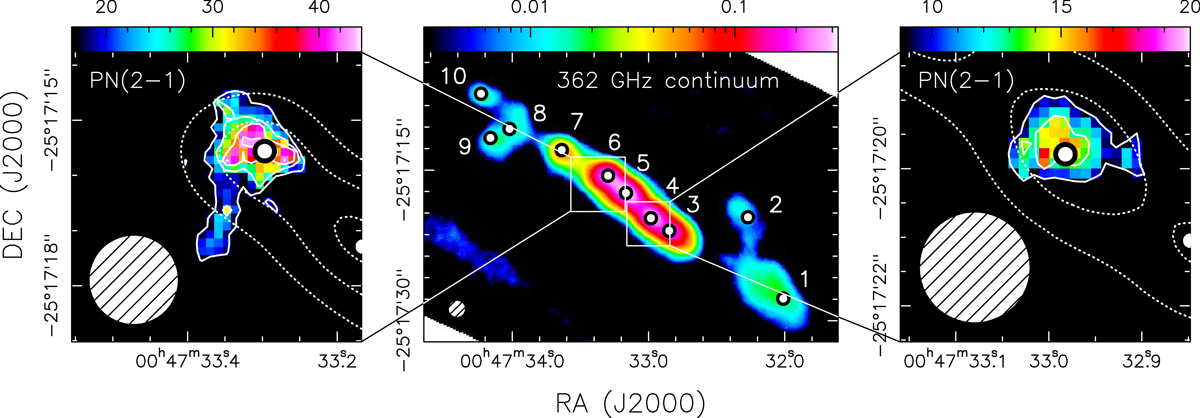
Fig. 1.
Download original image
Centre: continuum map of the CMZ of NGC 253 at 362 GHz with a coloured scale indicating the emission in Jy beam−1. The numbered circles represent the brightest points of each GMC detected by Leroy et al. (2015). The synthesised beam of the observations (1.6″) is shown in the lower left corner of each panel with a white hatched circle. Left: zoomed in view towards GMC 6 of the integrated emission between 120 and 240 km s−1. Right: zoomed in view towards GMC 4 of the integrated emission between 220 and 260 km s−1. Figures on the sides have their integrated emission scale in mJy beam−1 km s−1 starting at 2σ. The white dashed contour levels indicate the continuum emission for 0.1, 0.2, and 0.3 Jy beam−1. Solid white contours indicate 2σ, 3σ, 4σ and 5σ levels of the PN detection.
Current usage metrics show cumulative count of Article Views (full-text article views including HTML views, PDF and ePub downloads, according to the available data) and Abstracts Views on Vision4Press platform.
Data correspond to usage on the plateform after 2015. The current usage metrics is available 48-96 hours after online publication and is updated daily on week days.
Initial download of the metrics may take a while.