Fig. 10
Download original image
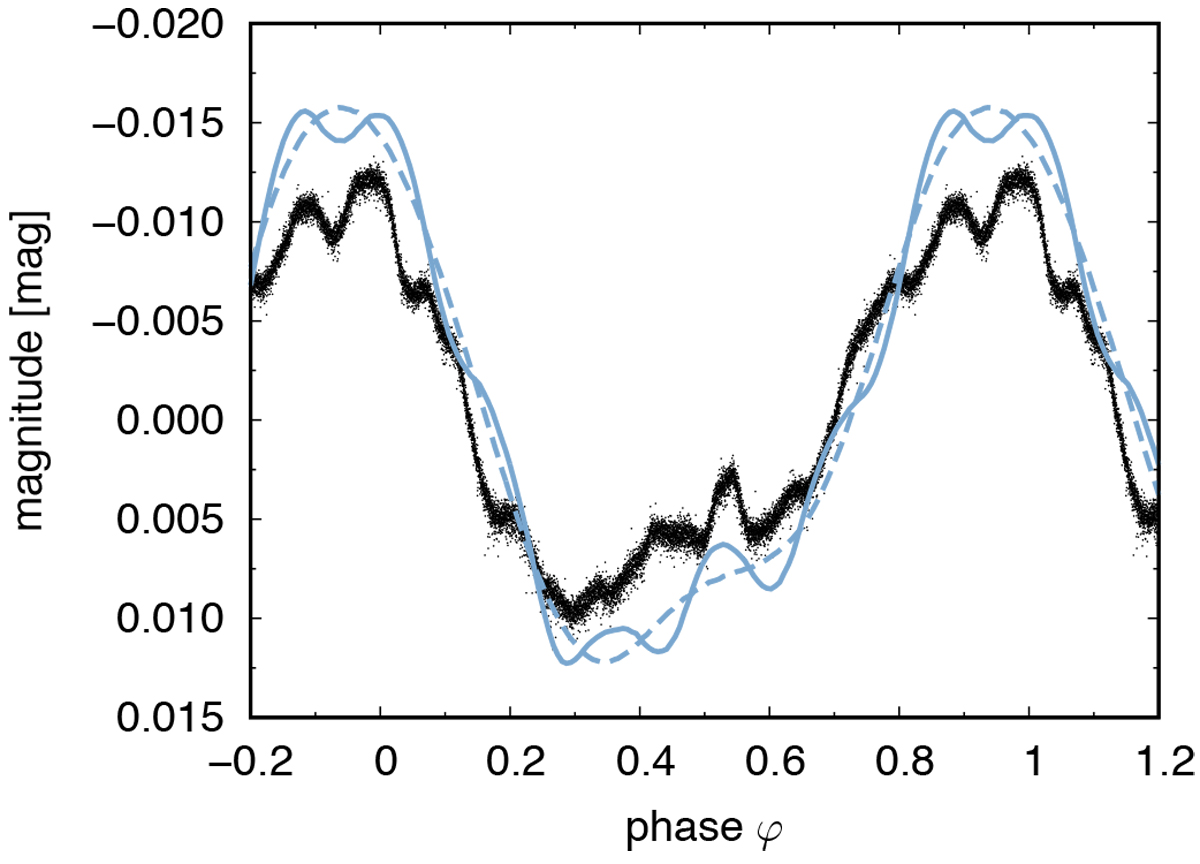
Simulated light curve of HD 37776 derived assuming the silicon and helium surface distribution by Khokhlova et al. (2000) and modulated by n = 3 and l = 3 multipole (solid line). This is compared with the TESS light curve phased with the nonlinear ephemeris from Mikulášek et al. (2020, dots) and with the light curve calculated purely from surface spots (dashed line). All light curves were shifted to derive a zero mean magnitude.
Current usage metrics show cumulative count of Article Views (full-text article views including HTML views, PDF and ePub downloads, according to the available data) and Abstracts Views on Vision4Press platform.
Data correspond to usage on the plateform after 2015. The current usage metrics is available 48-96 hours after online publication and is updated daily on week days.
Initial download of the metrics may take a while.