Free Access
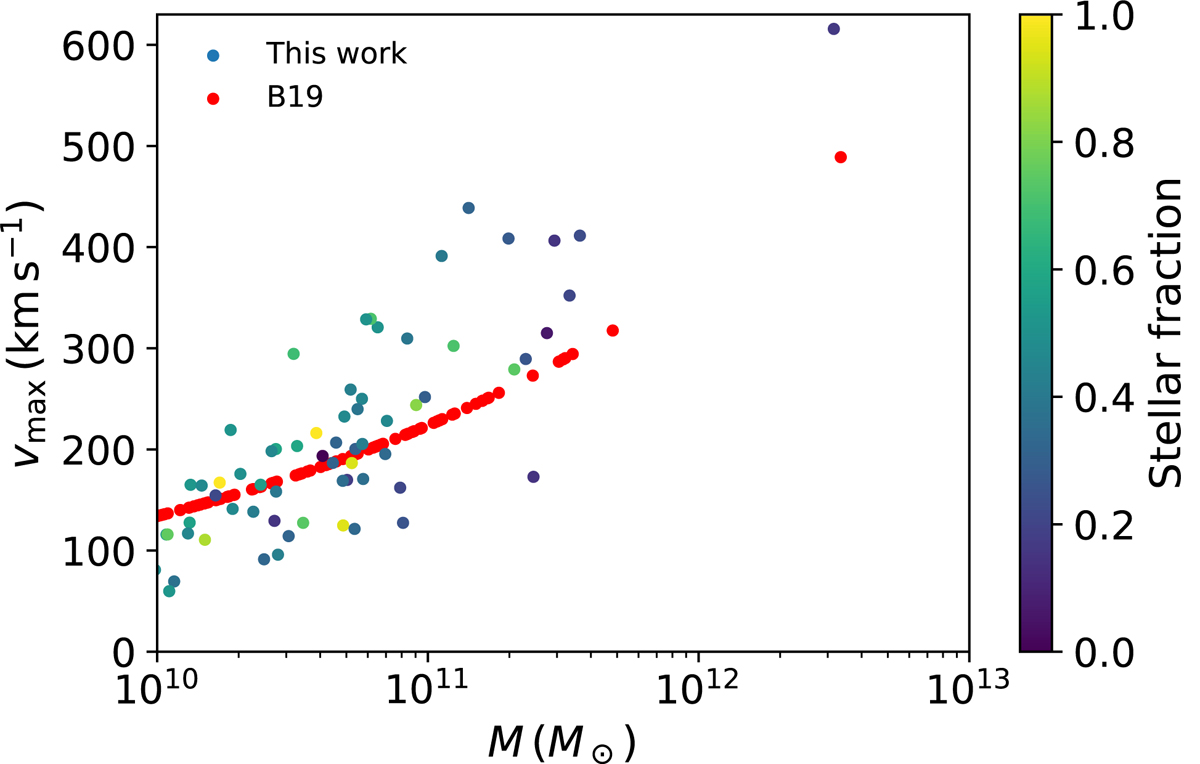
Fig. 12.
Download original image
Maximum circular velocity of the cluster members as a function of their total mass. The values predicted by the model presented in B19 are shown in red. Our values are colour-coded according to the predicted stellar over total mass fraction. Only members with M > 1010 M⊙ are shown.
Current usage metrics show cumulative count of Article Views (full-text article views including HTML views, PDF and ePub downloads, according to the available data) and Abstracts Views on Vision4Press platform.
Data correspond to usage on the plateform after 2015. The current usage metrics is available 48-96 hours after online publication and is updated daily on week days.
Initial download of the metrics may take a while.