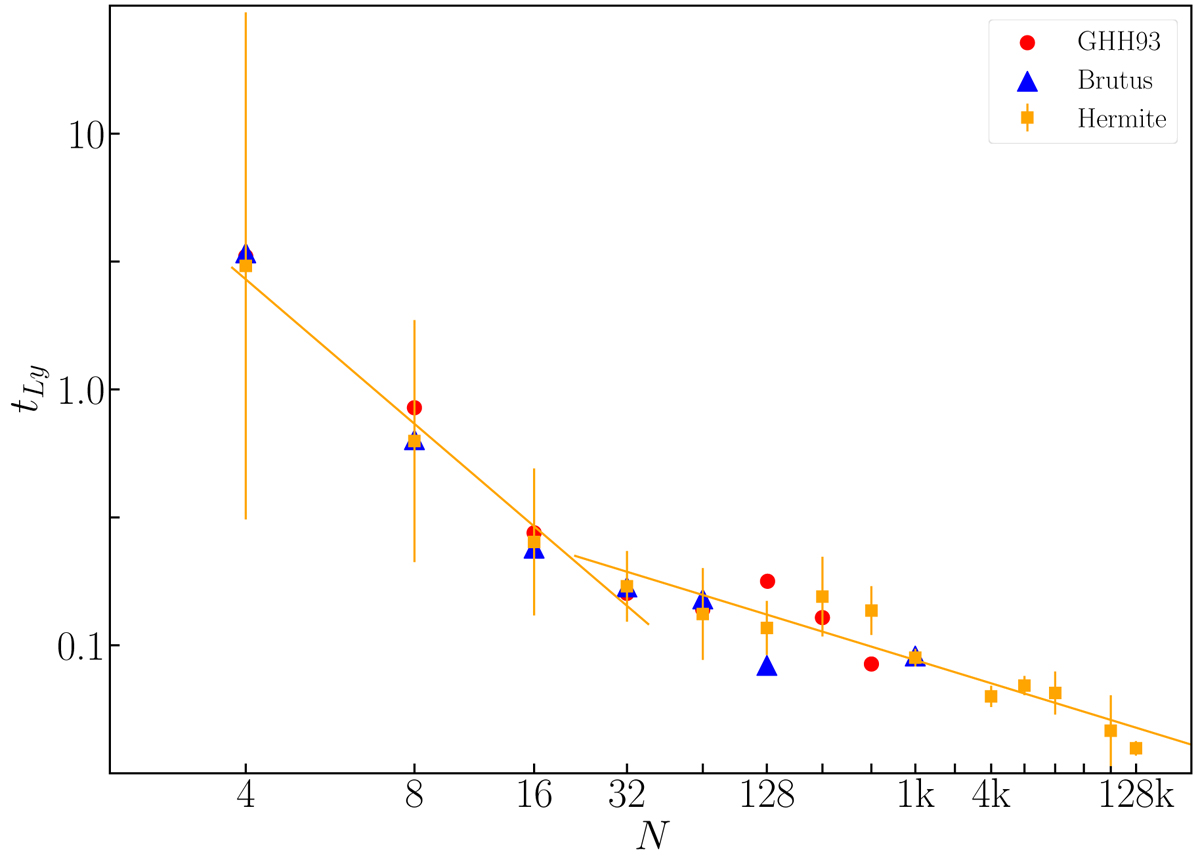
Fig. 7.
Download original image
Estimate of the Lyapunov timescale as a function of the number of particles. Here the horizontal axis is not linear, but in ln(ln(N)) to illustrate the scaling proposed in Goodman et al. (1993). The different symbols and colors represent different calculations (see legend). The vertical bars, plotted for Newton’s Hermite only, show the root-mean-square of the dispersion in the series of solutions. The error bars in the results obtained with Brutus are statistically indistinguishable from the presented bars.
Current usage metrics show cumulative count of Article Views (full-text article views including HTML views, PDF and ePub downloads, according to the available data) and Abstracts Views on Vision4Press platform.
Data correspond to usage on the plateform after 2015. The current usage metrics is available 48-96 hours after online publication and is updated daily on week days.
Initial download of the metrics may take a while.